Discover the versatile 5×2 Two-Level Chart template that elevates your presentations with its modern and intuitive design for PowerPoint and Google Slides. Editable graphics with icons and text placeholders.
5×2 Two-Level Chart
A well-designed slide can speak volumes and spare you lengthy explanations. In fact, that’s why we recommend incorporating our latest addition, the 5×2 Two-Level Chart for PowerPoint and Google Slides, into your presentations to seamlessly convey complex, interconnected ideas. Elevate your infographics with this versatile, free template.
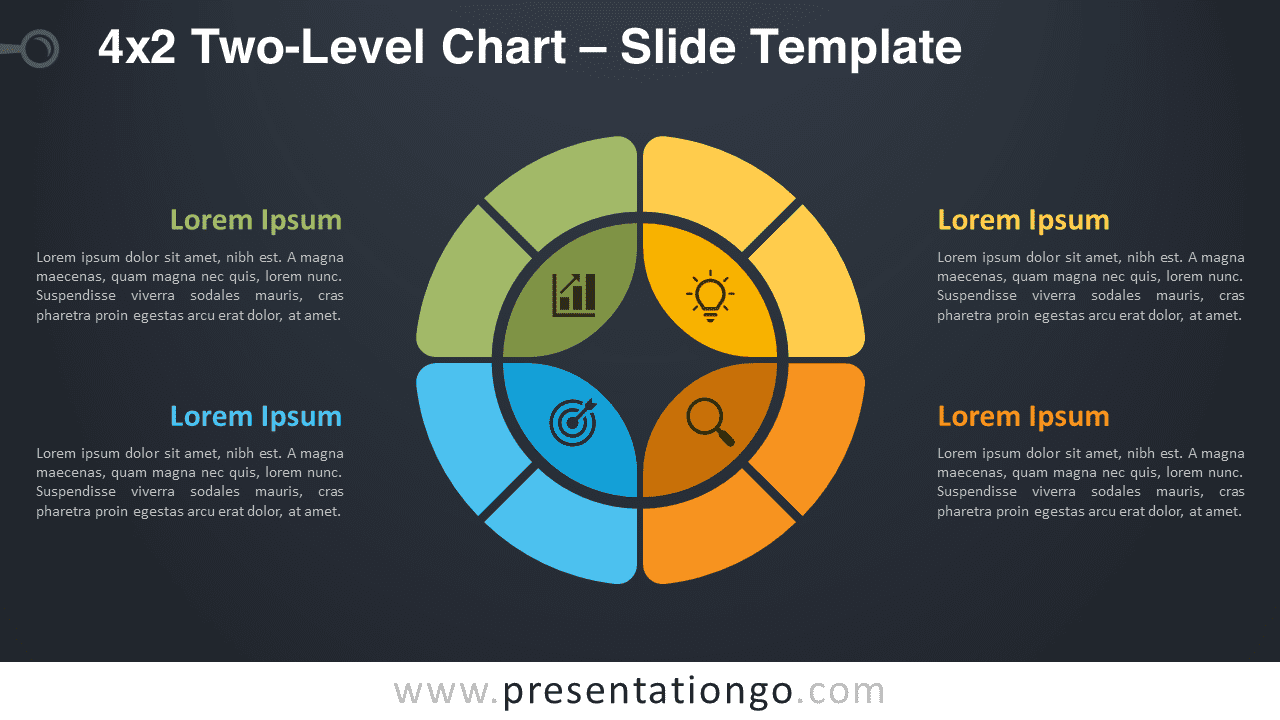
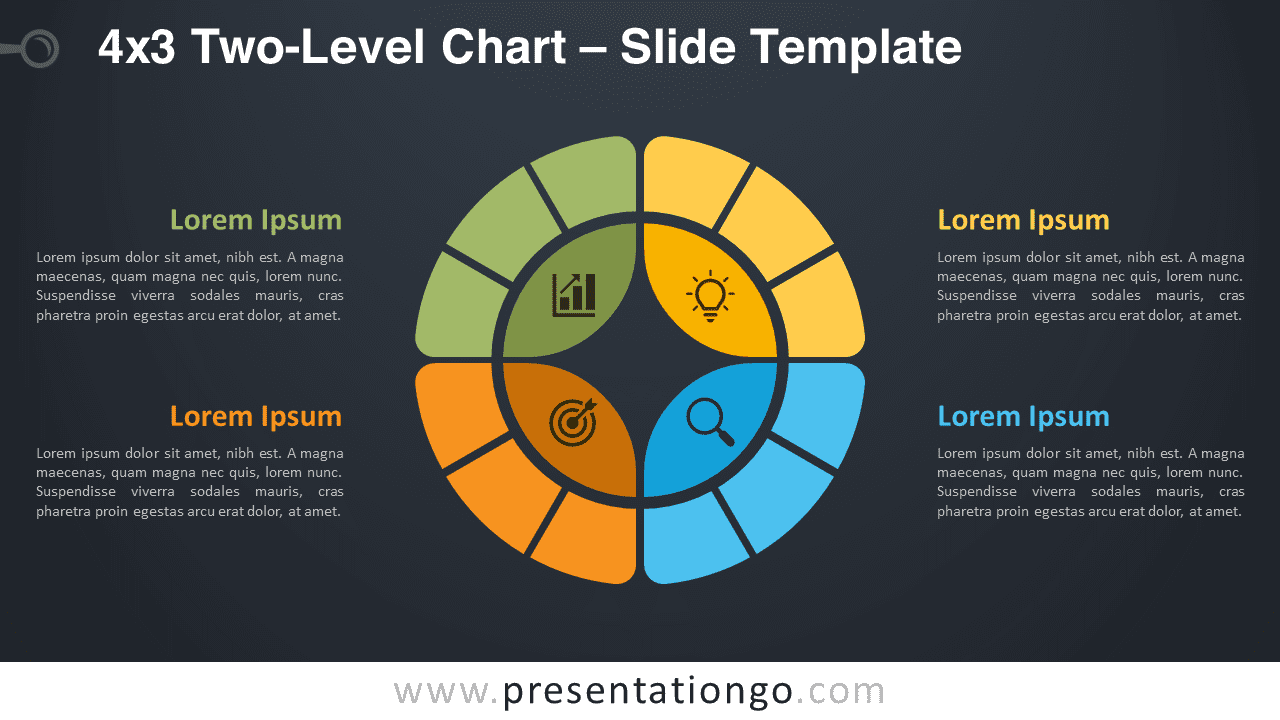
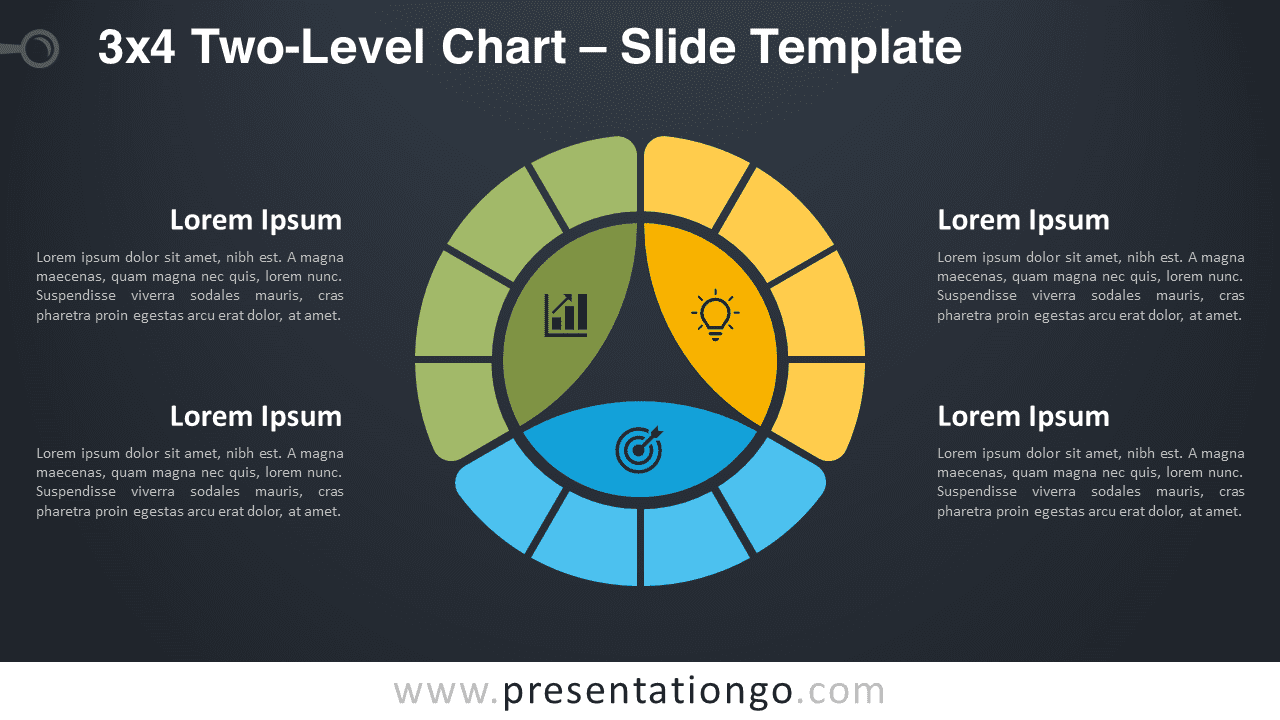
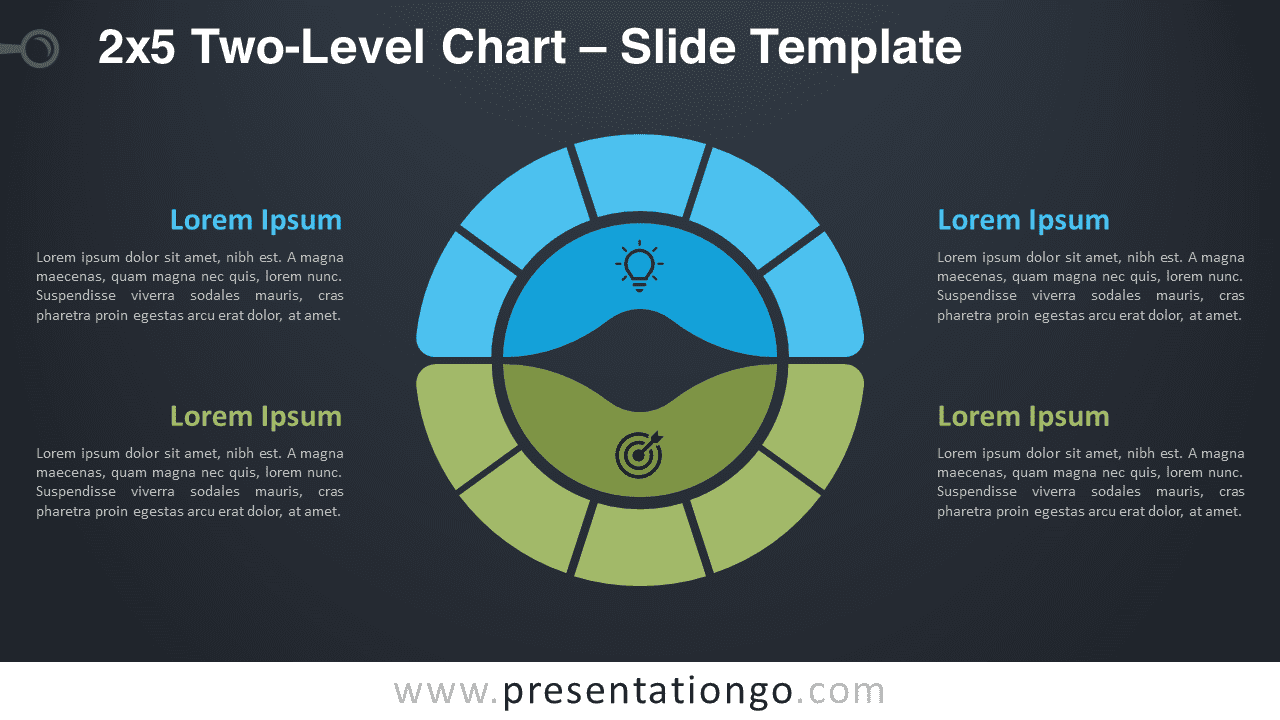
As a matter of fact, this multi-level (doughnut or donut) chart offers a powerful data visualization technique to showcase hierarchical relationships across multiple series.
The modern, intuitive design of our slide ensures easy comprehension for your audience. Its circular and colorful layout breaks down information into manageable, visually appealing segments. The chart features an inner circle at the center, divided into five distinct parts, each accompanied by an icon to illustrate your idea or step. This serves as the root node. Surrounding this inner circle is an outer circle, where each section of the inner circle is further split into two equal parts. These child items clarify their contributions to the parent category they belong to.
Moreover, text placeholders on both sides of the chart allow you to provide detailed explanations for your ideas, thoughts, facts, or items of information. Consequently, your audience can easily follow along and understand the interconnected relationships being presented.
Emphasizing the versatility of the 5×2 Two-Level Chart for PowerPoint and Google Slides, this template is perfect for showcasing linked information, hierarchies, or ideas. Don’t miss out on the opportunity to enhance your presentations with this must-have doughnut chart.
In conclusion, take your presentations to new heights with our free 5×2 Two-Level Chart template. Experience the power of captivating data visualization. Download it now and leave a lasting impression on your audience.
Shapes are 100% editable: colors and sizes can be easily changed.
Includes 2 slide option designs: Standard (4:3) and Widescreen (16:9).
Widescreen (16:9) size preview:


This ‘5×2 Two-Level Chart’ template features:
- 2 unique slides
- Light and Dark layout
- Ready to use template with icons and text placeholders
- Completely editable shapes
- Uses a selection of editable PowerPoint icons
- Standard (4:3) and Widescreen (16:9) aspect ratios
- PPTX file (PowerPoint) and for Google Slides
Free fonts used:
- Helvetica (System Font)
- Calibri (System Font)
The complete Two-Level Chart collection: