This free 4×3 Two-Level Chart for PowerPoint and Google Slides will help you complex, interconnected ideas, and hierarchies effectively. Editable graphics with icons and text placeholders.
4×3 Two-Level Chart
A strategically designed slide can express ideas more powerfully than an exhaustive speech. For this reason, the 4×3 Two-Level Chart for PowerPoint and Google Slides will be a key asset to your presentations. This free template will let you seamlessly share complex, connected ideas while upgrading your infographics.
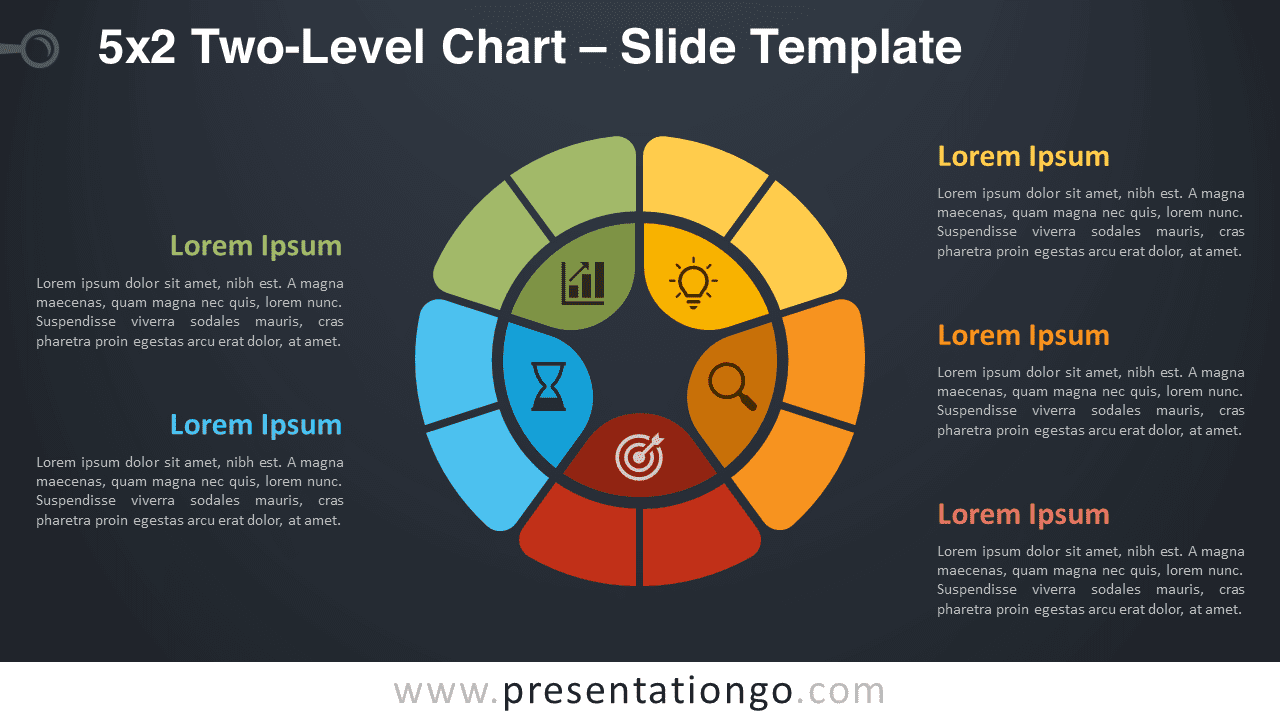
Multi-level doughnut charts actually leverage an exceptional data visualization technique to display hierarchical associations across various series.
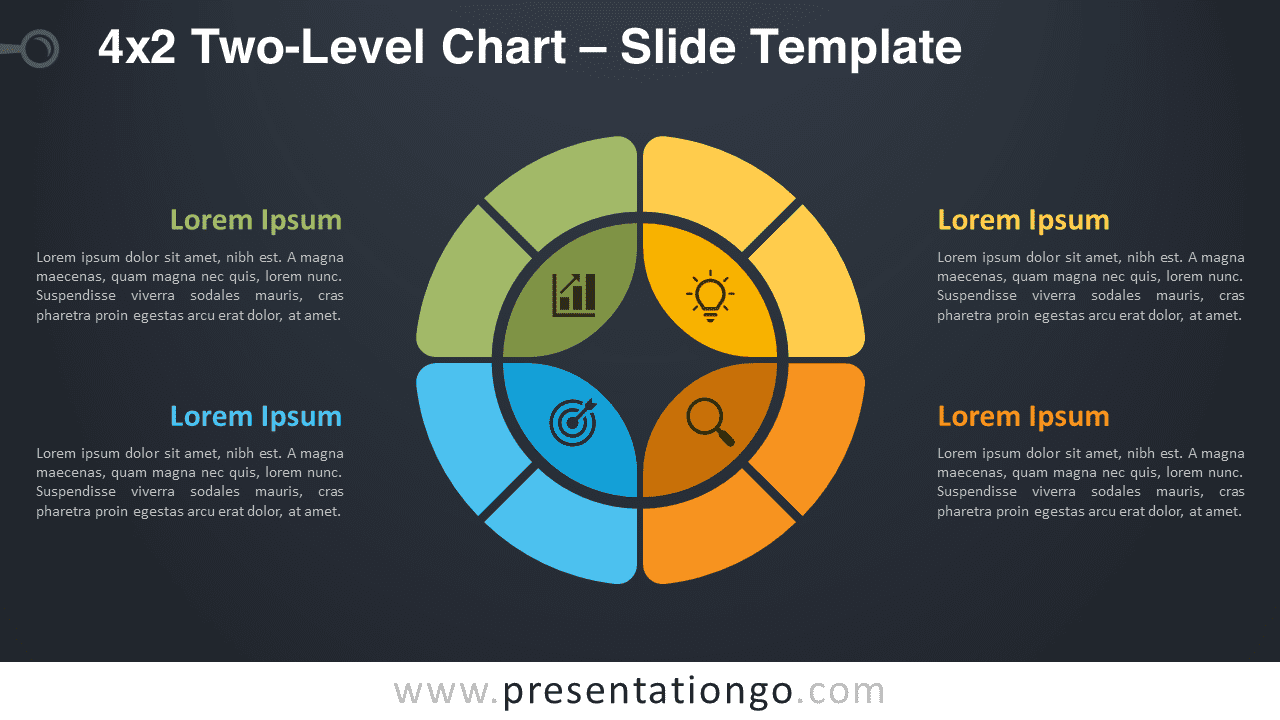
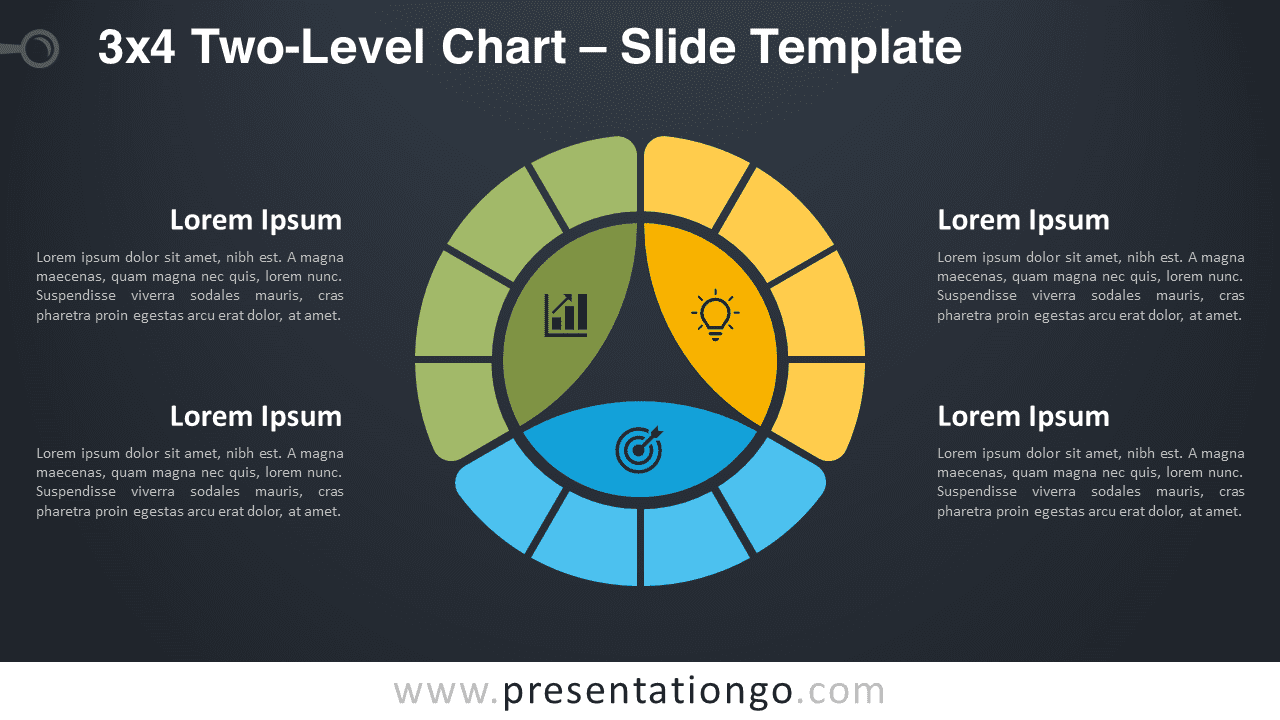
The contemporary, straightforward design of this specific diagram ensures easy comprehension for your audience. Its circular, vibrant structure arranges information into clear, visually striking segments. The chart presents an inner circle in the center, segmented into four distinct areas, each accompanied by an icon to represent your idea or step. This forms the root node. Around this inner circle, an outer circle exists where each section of the inner circle is divided into three equal parts. These child items illustrate their relationship to the parent category they correspond to.
Moreover, text placeholders on both sides of the chart provide space for you to present in-depth explanations of your ideas, thoughts, facts, or pieces of information. This allows your audience to easily grasp the interconnected relationships being displayed.
Highlighting the flexibility of the 4×3 Two-Level Chart for PowerPoint and Google Slides, this template is ideal for demonstrating linked information, hierarchies, or concepts. Make the most of this essential doughnut chart to elevate your presentations!
Shapes are 100% editable: colors and sizes can be easily changed.
Includes 2 slide option designs: Standard (4:3) and Widescreen (16:9).
Widescreen (16:9) size preview:


This ‘4×3 Two-Level Chart’ template features:
- 2 unique slides
- Light and Dark layout
- Ready to use template with icons and text placeholders
- Completely editable shapes
- Uses a selection of editable PowerPoint icons
- Standard (4:3) and Widescreen (16:9) aspect ratios
- PPTX file (PowerPoint) and for Google Slides
Free fonts used:
- Helvetica (System Font)
- Calibri (System Font)
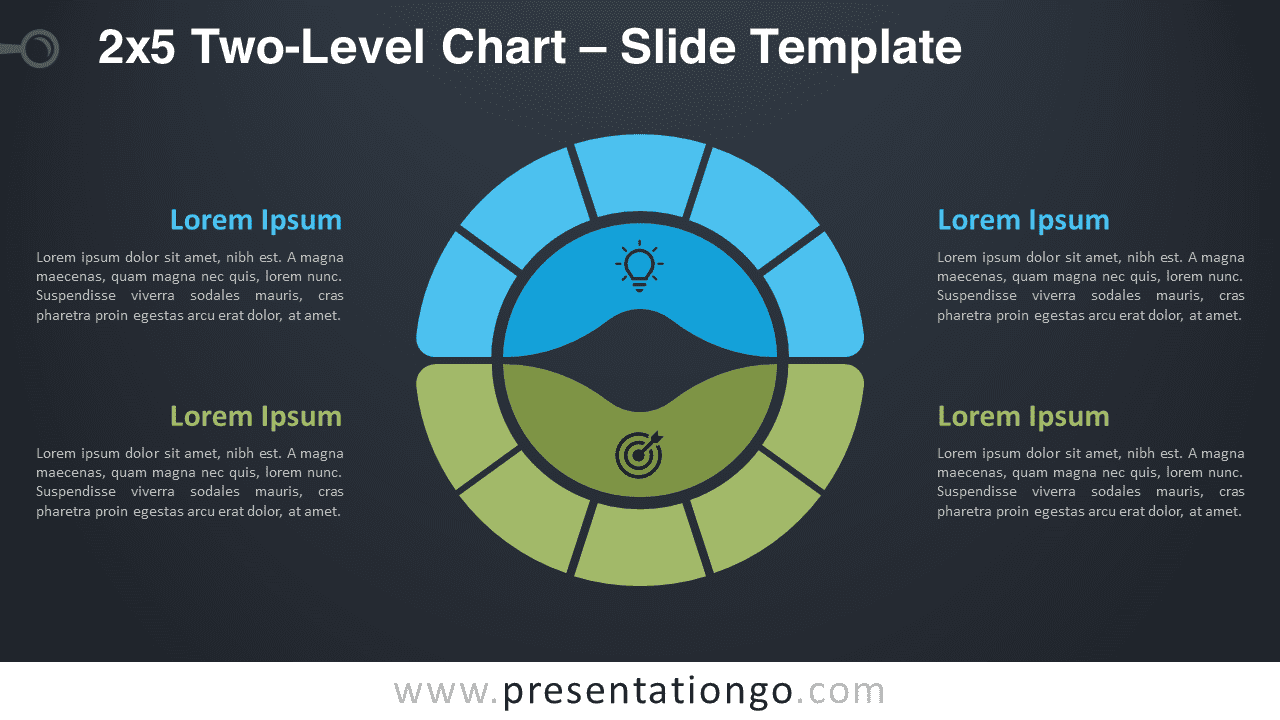
The complete Two-Level Chart collection: