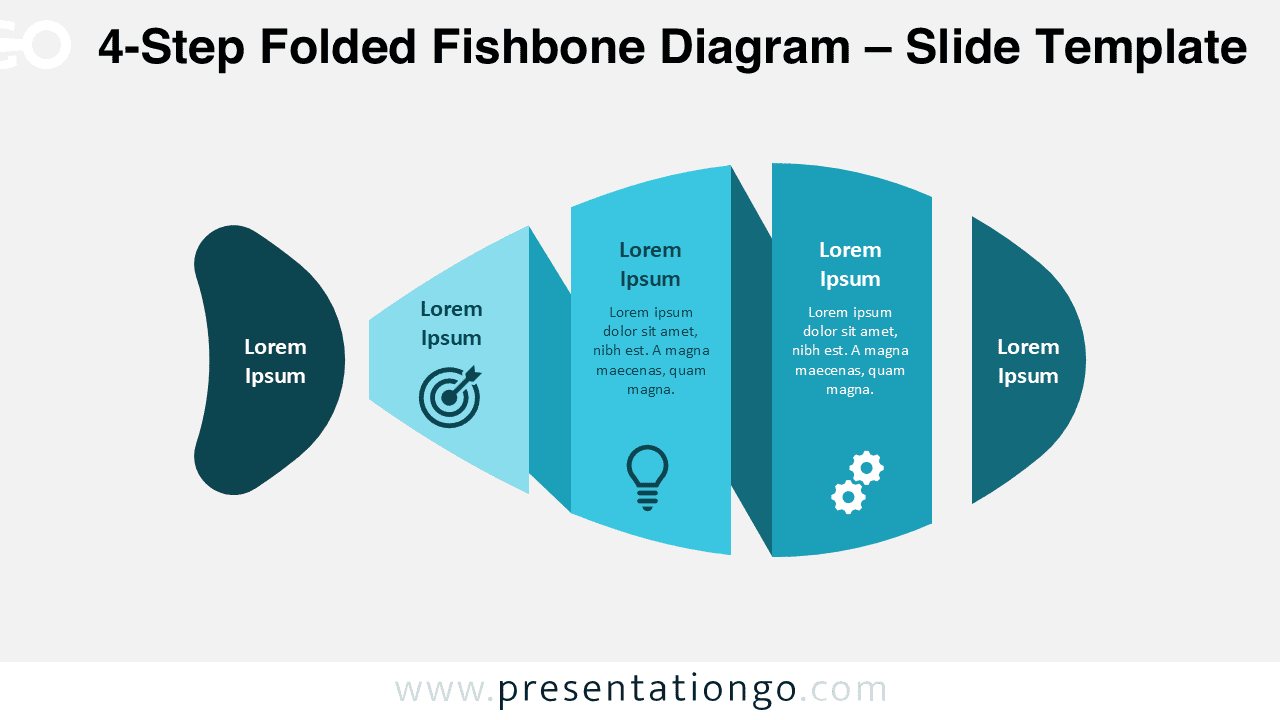
The 4-Step Folded Fishbone Diagram is a modern interpretation of the classic Ishikawa cause-and-effect model. It helps presenters structure root cause analysis clearly while maintaining a visually engaging layout.
Designed for PowerPoint and Google Slides, this diagram uses a folded paper effect and smooth curved shapes to guide the audience through contributing factors that lead to a central problem or outcome.
Diagram Preview


Features and Customization Options
- Four clearly separated folded segments for structured cause analysis
- Editable shapes and text areas for full customization
- Includes editable icon placeholders for visual reinforcement
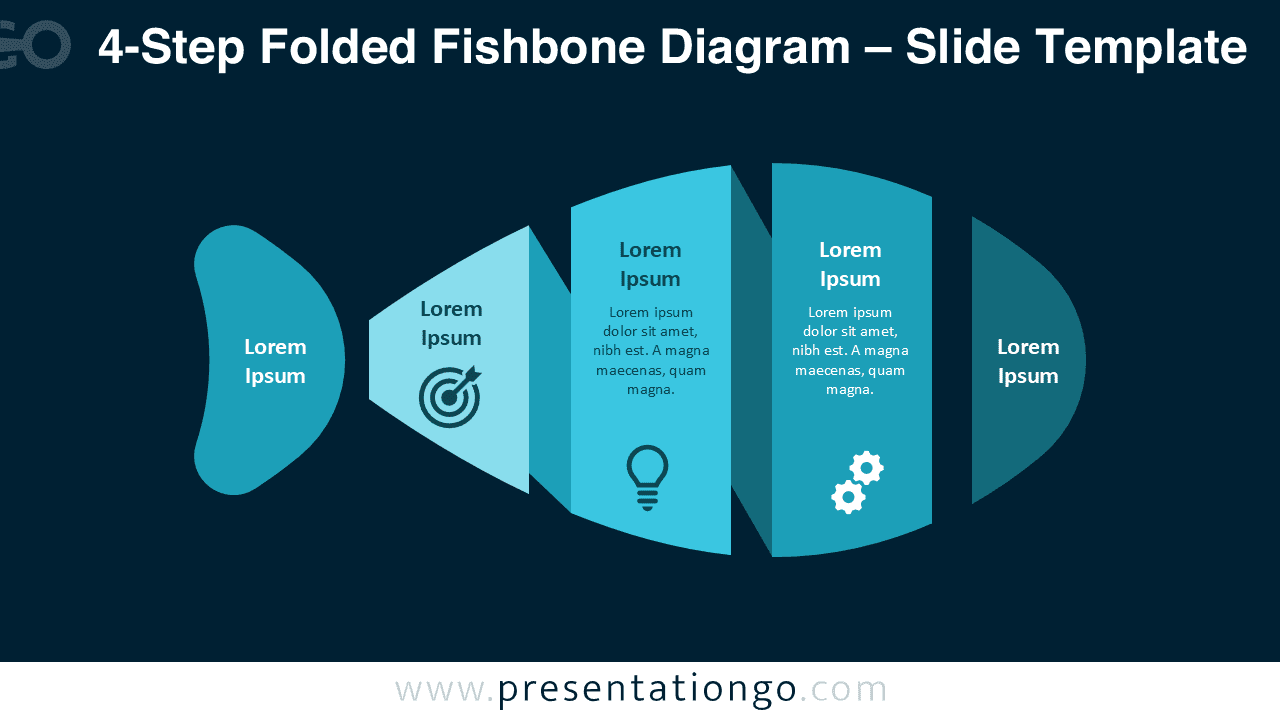
- Optimized for both light and dark presentation backgrounds
- Fully compatible with PowerPoint and Google Slides
Design and Structure
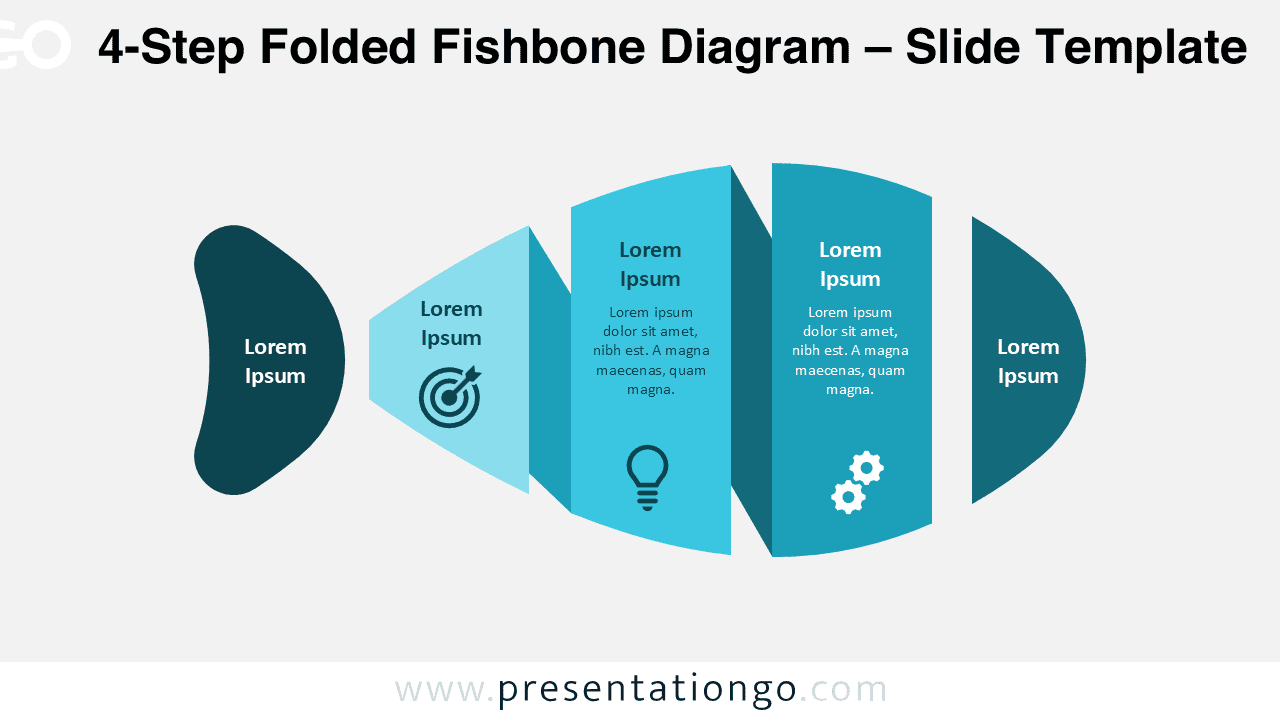
This 4-step fishbone diagram arranges causes along a horizontal spine, following the traditional Ishikawa layout while introducing a contemporary folded design.
Each folded segment represents a distinct category of causes, making it easy to explain relationships between contributing factors and the final effect. The layered folds create depth and separation without overwhelming the slide.
The curved geometry softens the analytical nature of root cause analysis and improves visual flow. Icons can be used to symbolize cause categories such as processes, people, technology, or environment.
Practical Applications
- Root cause analysis and Ishikawa problem-solving sessions
- Quality management and continuous improvement initiatives
- Risk identification and operational reviews
- Business process analysis and troubleshooting
- Training materials and workshop presentations
Summary
The 4-Step Folded Fishbone Diagram combines analytical clarity with a modern visual style. It is an effective tool for explaining cause-and-effect relationships in business, quality, and strategy presentations using PowerPoint and Google Slides.