Skip to content
PresentationGO
  • Explore
    • Templates
      • Abstract
      • Sports
      • Business
      • Religion & Holidays
      • Nature
      • Technology
      • Professions
      • Flat Lays & Scenes
      • Health & Recreation
      • Color Palettes
      • Education
      • Food & Drink
      • Science
      • CertificatesNEW
      • All Templates
    • Charts & Diagrams
      • Processes
        • Circular
        • Linear
        • Alternating
        • Stairs
        • Bending
      • Funnels
      • Pyramids
      • Matrix Charts
      • Business Models
      • Non-Data-Driven Chart Alternatives
      • Radial Diagrams
      • Flow Charts
      • Data-Driven Charts & Graphs
      • Organizational Charts
      • Clusters & Relationships
      • Venn Diagrams
      • All Charts & Diagrams
    • Text & Tables
      • Text Boxes
      • Comparisons
      • Paper & Banners
      • Numbered Lists
      • Speaking Bubbles
      • Pricing Tables
      • Bullet Point / Text Layouts
      • Contents & Table of Contents
      • Quotes
      • Word Clouds
      • To-do & Checklists
      • All Text & Tables
    • Timelines & Planning
      • Calendars
      • Timelines
      • Gantt Charts
      • Agenda
      • All Timelines & Planning
    • Graphics & Metaphors
      • Concepts
      • Silhouettes & People
      • Light Bulbs
      • Trees
      • Letters & Numbers
      • Signs
      • Mockups
      • Food
      • Money
      • Road
      • Target and Goals
      • All Graphics & Metaphors
    • Maps & Flags
      • Flag Templates
      • Continent Maps
      • Country Maps
        • Africa
        • Asia
        • Australia / Oceania
        • Europe
        • North America
        • South America
      • World Maps
      • All Maps
    • AI ImagesNEW
  • Search by
    • Colors
      • Black
      • Blue
      • Brown
      • Gray
      • Green
      • Cream
      • Light Blue
      • Orange
      • Pink
      • Purple
      • Gold
      • Red
      • White
      • Yellow
      • Teal
    • Steps (Options)
      • 2 options
      • 3 options
      • 4 options
      • 5 options
      • 6 options
      • 7 options
      • 8 options
      • 9 options
      • 10 options
      • 12 options
  • Templates
  • Charts & Diagrams
  • Text & Tables
  • Timelines & Planning
  • Graphics & Metaphors
  • Maps & Flags
  • AI ImagesNEW

Charts & Diagrams

Transform complex data into clear visuals with our extensive collection of 1,707 Charts & Diagrams templates for PowerPoint and Google Slides. Choose from flowcharts, mind maps, data-driven graphs, organizational charts, and more to engage your audience and enhance your presentations.

Main Charts & Diagrams Categories:ProcessesShapesRadial DiagramsMatrix ChartsGeometric ShapesNon-Data-Driven Chart AlternativesBusiness ModelsData-Driven Charts & GraphsFlow ChartsOrganizational ChartsStagesVenn DiagramsMulti-Level ChartsClusters & RelationshipsTrees
Six-part radial core diagram for PowerPoint and Google Slides showing a circular layout with six segments and editable icons.
Charts & Diagrams
6 options

Six-Part Radial Core Diagram

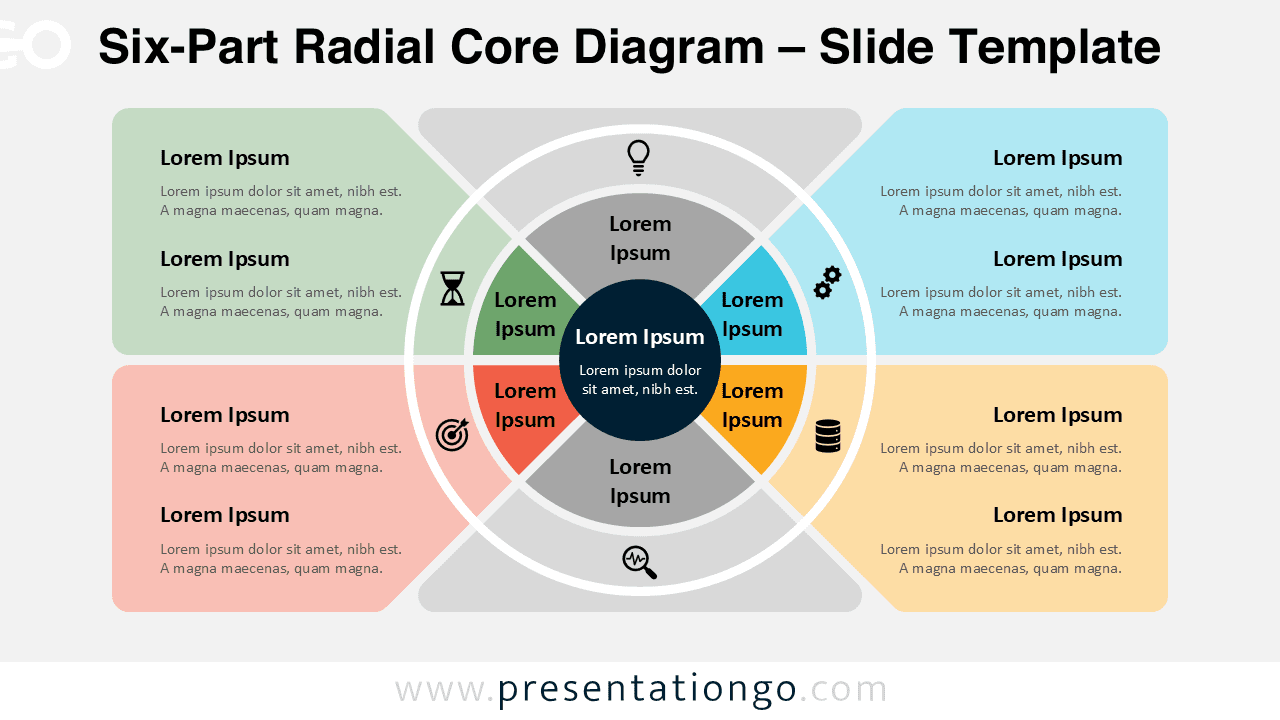
A six-part radial diagram, ideal for complex frameworks and multi-step processes in PowerPoint and Google Slides.

Google Slides, PPTX

16:9

Four-part radial core diagram for PowerPoint and Google Slides showing a circular layout with four segments and editable icons.
Charts & Diagrams
4 options

Four-Part Radial Core Diagram

Present four key ideas in PowerPoint and Google Slides with this modern radial core diagram design.

Google Slides, PPTX

16:9

6-step funnel process flow diagram for PowerPoint and Google Slides showing complex workflow stages in a structured funnel design
Charts & Diagrams
6 options

6-Step Funnel Process Flow

Present complex sales funnels or end-to-end customer journeys with this 6-step funnel process flow diagram for PowerPoint.

Google Slides, PPTX

16:9

5-step funnel process flow diagram for PowerPoint and Google Slides illustrating detailed workflow stages in a vertical funnel layout
Charts & Diagrams
5 options

5-Step Funnel Process Flow

Break down detailed marketing funnels or customer journeys with this 5-step funnel process flow diagram for PowerPoint.

Google Slides, PPTX

16:9

4-step funnel process flow diagram for PowerPoint and Google Slides with four stages illustrating structured workflow and conversion steps
Charts & Diagrams
4 options

4-Step Funnel Process Flow

Visualize structured workflows like sales pipelines or project phases with this 4-step funnel process flow diagram for PowerPoint.

Google Slides, PPTX

16:9

3-step funnel process flow diagram for PowerPoint and Google Slides showing a vertical conversion funnel with three stages and clear layout
Charts & Diagrams
3 options

3-Step Funnel Process Flow

Showcase key stages with this editable 3-step funnel flow design.

Google Slides, PPTX

16:9

Wave Process Flow diagram for PowerPoint and Google Slides showing a colorful curved multi-step workflow with icons and smooth transitions
Charts & Diagrams
7 options

Wave Process Flow

A modern wave-style process diagram for PowerPoint and Google Slides with curved arrows and icons.

Google Slides, PPTX

16:9

5-Step Segmented Cycle Process diagram for PowerPoint and Google Slides featuring a circular workflow with five segments and editable icons.
Charts & Diagrams
5 options

5-Step Segmented Cycle Process

Download this free 5-Step Segmented Cycle Process diagram for PowerPoint and Google Slides to illustrate workflows, strategy frameworks, and iterative processes.

Google Slides, PPTX

16:9

4-Step Segmented Cycle Process diagram for PowerPoint and Google Slides with circular workflow segments and icons representing stages of a process.
Charts & Diagrams
4 options

4-Step Segmented Cycle Process

Download this free 4-Step Segmented Cycle Process diagram for PowerPoint and Google Slides to illustrate workflows, strategies, and continuous improvement cycles.

Google Slides, PPTX

16:9

3-Step Segmented Cycle Process diagram for PowerPoint and Google Slides showing a circular workflow with three segments, icons, and editable text areas.
Charts & Diagrams
3 options

3-Step Segmented Cycle Process

Use this circular 3-step process diagram to present strategies, workflows, or continuous improvement models in PowerPoint and Google Slides.

Google Slides, PPTX

16:9

9-step linked chain workflow diagram for PowerPoint with interlocking chain shapes illustrating sequential process stages, also editable in Google Slides.
Charts & Diagrams
9 options

9-Step Linked Chain Workflow

Present nine connected workflow stages with the 9-Step Linked Chain Workflow diagram for PowerPoint and Google Slides.

Google Slides, PPTX

16:9

8-step linked chain workflow diagram for PowerPoint with interlocking chain shapes representing sequential process stages, also editable in Google Slides.
Charts & Diagrams
8 options

8-Step Linked Chain Workflow

Present eight connected workflow stages with the 8-Step Linked Chain Workflow diagram for PowerPoint and Google Slides.

Google Slides, PPTX

16:9

Older posts
Newer posts
← Previous Page1 … Page3 Page4 Page5 … Page143 Next →
Search Templates by categories
Templates Charts & Diagrams Text & Tables Maps & Flags Timelines & Planning Graphics & Metaphors
Search Templates by colors
Support us
icon of a coffee cup for 'support us' - PresentationGo
... buying us a coffee

Love our templates? Show your support with a coffee!

Donate Here

Thank you for fueling our creativity!

Logotype PresentationGo
Content

Templates

Charts & Diagrams

Text & Tables

Graphics & Metaphors

Timelines & Planning

Maps

AI ImagesNEW

Best-Ofs & Tips

Legal

Terms and Conditions

Privacy Statement

Cookie Policy

Digital Millennium Copyright Act (DMCA) Policy

Disclaimer

Help

Contact us

FAQ

Templates

Charts & Diagrams

Text & Tables

Graphics & Metaphors

Timelines & Planning

Maps

Best-Ofs & Tips

Terms and Conditions

Privacy Statement

Cookie Policy

Digital Millennium Copyright Act (DMCA) Policy

Disclaimer

Contact us

FAQ

© Copyright 2026 Ofeex | PRESENTATIONGO® is a registered trademark | All rights reserved.

PresentationGO
Cookies & Privacy

To provide the best experiences, we and our partners use technologies like cookies to store and/or access device information. Consenting to these technologies will allow us and our partners to process personal data such as browsing behavior or unique IDs on this site and show (non-) personalized ads. Not consenting or withdrawing consent, may adversely affect certain features and functions.

Click below to consent to the above or make granular choices. Your choices will be applied to this site only. You can change your settings at any time, including withdrawing your consent, by using the toggles on the Cookie Policy, or by clicking on the manage consent button at the bottom of the screen.

Functional Always active
Needed for the website to work properly.
Preferences
Remember your settings (like language or display choices).
Statistics
The technical storage or access that is used exclusively for statistical purposes. Help us understand how the site is used so we can improve it (Google Analytics).
Marketing
Used to show relevant ads and measure ad performance (Google AdSense and partners).
Statistics

Marketing

Features
Always active

Always active
  • Manage options
  • Manage services
  • Manage {vendor_count} vendors
  • Read more about these purposes
Manage preferences
  • {title}
  • {title}
  • {title}
PresentationGO
Cookies & Privacy

We use cookies to run the site, measure traffic, and show ads that help keep our downloads free. Manage your choices anytime.

Functional Always active
Needed for the website to work properly.
Preferences
Remember your settings (like language or display choices).
Statistics
The technical storage or access that is used exclusively for statistical purposes. Help us understand how the site is used so we can improve it (Google Analytics).
Marketing
Used to show relevant ads and measure ad performance (Google AdSense and partners).
Statistics

Marketing

Features
Always active

Always active
  • Manage options
  • Manage services
  • Manage {vendor_count} vendors
  • Read more about these purposes
Manage preferences
  • {title}
  • {title}
  • {title}

Thank you for downloading from PresentationGO!

AI Images are free to use with no attribution required (though appreciated).

Presentation templates are also free, but require attribution.
For example, you can include this credit somewhere visible:

If you enjoy our free resources and want to support us, you can:

Buy us a coffee

Thank you for your continued support!