Free ice cream infographics for PowerPoint. Graphic illustration of ice cream cones (or cornets) with up to 6 scoops of ice cream stacked. Editable graphics with numbers and text placeholders.
Ice Cream Infographics
Use these graphics like column charts to compare quantitative results.
Usage instructions:
Click the scoops of ice cream shapes, and stack them to fit your needs (quantitative results):
Shapes are 100% editable: colors and sizes can be easily changed.
Includes 2 slide option designs: Standard (4:3) and Widescreen (16:9).
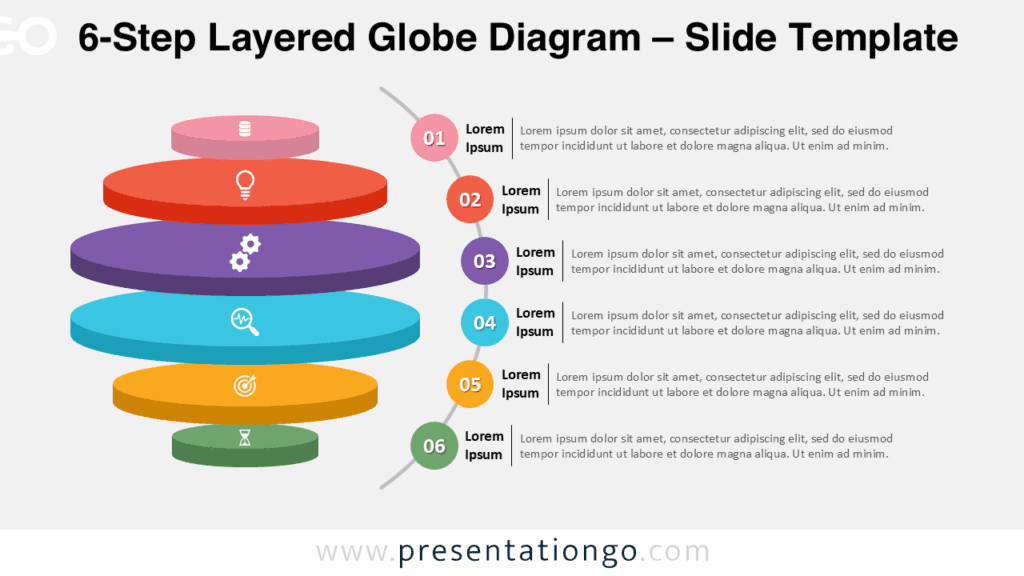
Widescreen (16:9) size preview:


This ‘Ice Cream Infographics for PowerPoint’ features:
- 2 unique slides
- Light and Dark layout
- Ready to use template with numbers and text placeholders
- Completely editable shapes
- Standard (4:3) and Widescreen (16:9) aspect ratios
- PPTX file (PowerPoint)
Free fonts used:
- Helvetica (System Font)
- Calibri (System Font)


Comments are closed.