Free increasing bar chart and heat map for PowerPoint and Google Slides. An editable graphic combining a column chart with heatmap.
Increasing Bar Chart and Heat Map
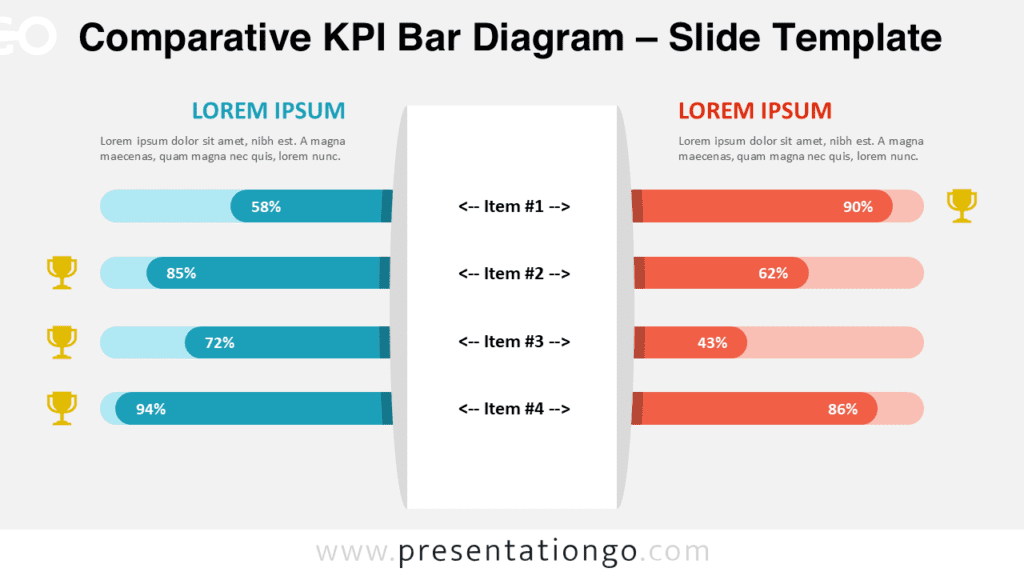
Do you need to share complex quantitative results and make them easy to understand for your audience? Try this free Increasing Bar Chart and Heat Map template. It will both elevate and enlighten everybody!
This original and creative slide displays 5 vertical bars with increasing height. They look like buildings, from a 2-story condo to a skyscraper! This is mainly because they all have little colorful rectangles of distinct colors that look like windows. This is indeed where you can include the colors of your heat map. Moreover, you can include a number (or a title or an icon) at the top of each building to number, name or illustrate your bar chart. Finally, there is a title and text placeholder on the left to explain your quantitative results with words.
This free Increasing Bar Chart and Heat Map template is fantastic to simplify data visualization. You can use both color and length to compare various categories in a data set.
Shapes are 100% editable: colors and sizes can be easily changed.
Includes 2 slide option designs: Standard (4:3) and Widescreen (16:9).
Widescreen (16:9) size preview:


This ‘Increasing Bar Chart and Heat Map’ template features:
- 2 unique slides
- Light and Dark layout
- Ready to use template with numbers and text placeholders
- Completely editable shapes
- Standard (4:3) and Widescreen (16:9) aspect ratios
- PPTX file (PowerPoint) and for Google Slides
Free fonts used:
- Helvetica (System Font)
- Calibri (System Font)