Free infographic circular bar chart for PowerPoint and Google Slides. Non-data-driven circular bar charts to compare quantitative results. Editable graphics with numbers and text placeholders.
Infographic Circular Bar Chart
We love infographics. As a matter of fact, infographics are great because they will make your data and information easy(ier) to visualize and to understand. Also, the originality and variety of your graphics will grab and hold the audience’s attention.
Let’s say it: you should already put this template in your favorites!
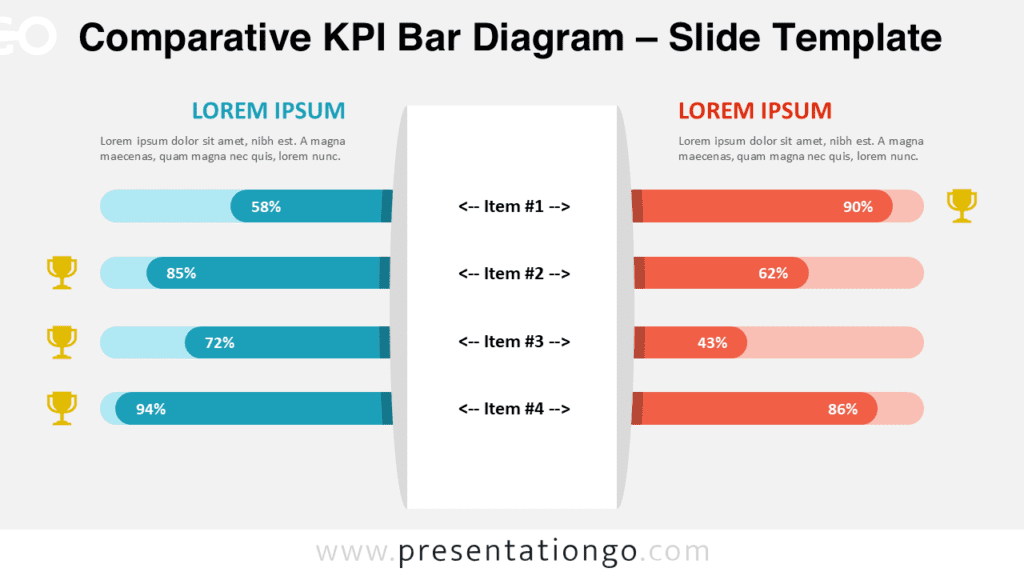
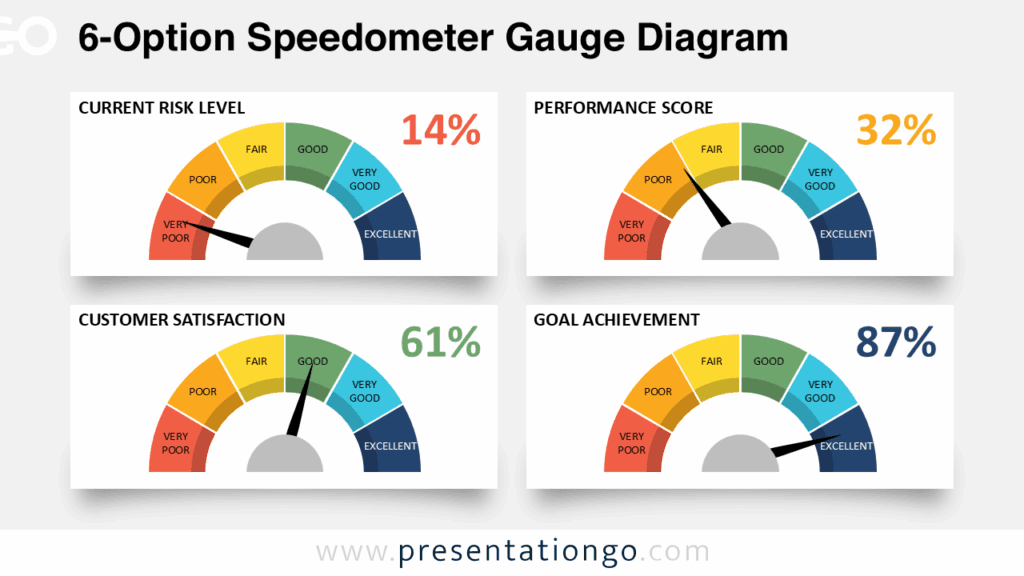
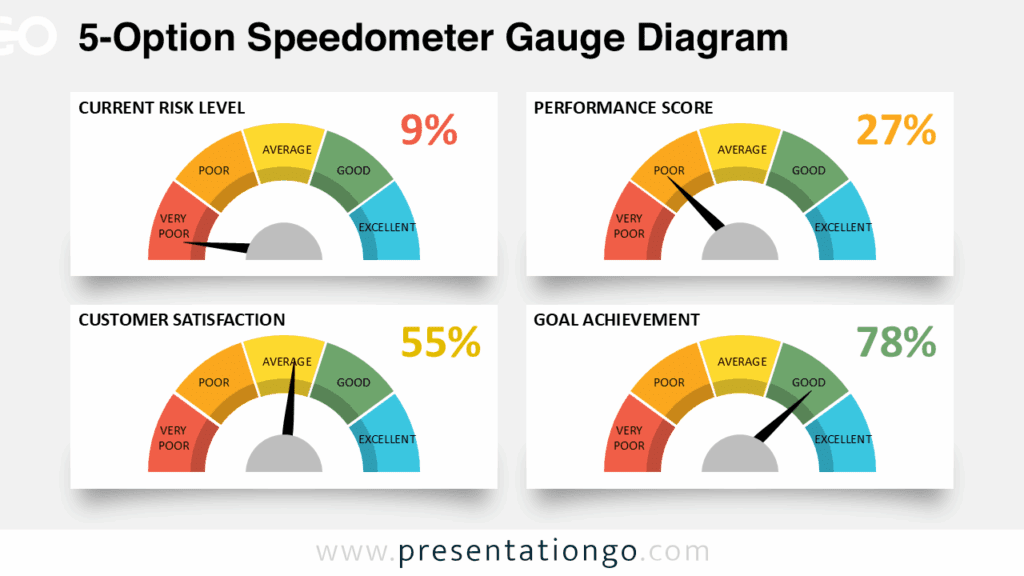
More specifically, these non-data-driven circular charts will be perfect to showcase your quantitative results. Also, they will make single percentages clearly comparable and straightforward.
Usage instructions:
To adapt the length of the circular bar, just click the arc shape, hold, drag, and release.

Shapes are 100% editable: colors and sizes can be easily changed.
Includes 2 slide option designs: Standard (4:3) and Widescreen (16:9).
Widescreen (16:9) size preview:


This ‘Infographic Circular Bar Chart for PowerPoint and Google Slides’ features:
- 2 unique slides
- Light and Dark layout
- Ready to use template with numbers and text placeholders
- Completely editable shapes
- Standard (4:3) and Widescreen (16:9) aspect ratios
- PPTX file and for Google Slides
Free fonts used:
- Helvetica (System Font)
- Calibri (System Font)