Free progress pie charts for PowerPoint and Google Slides. Donut pie chart with 20 editable slices. Non-data-driven chart alternative. Editable graphics with text placeholders.
Use these progress pie chart templates for quantitative results, to show percentages, completion results or progress. Great data visualization charts for a dashboard slide.
Usage instructions:
Select and fill every single slice with your color of choice.
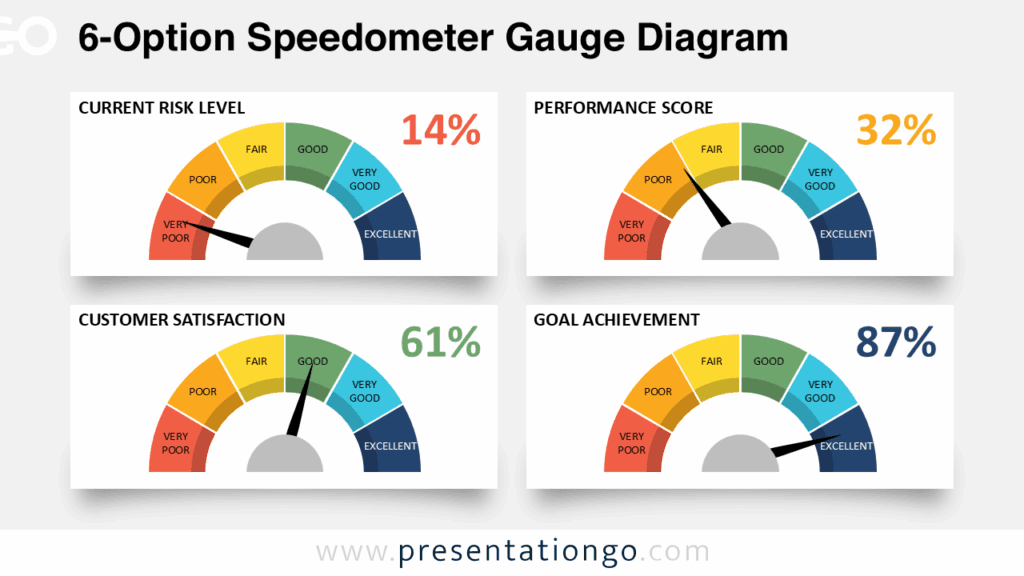
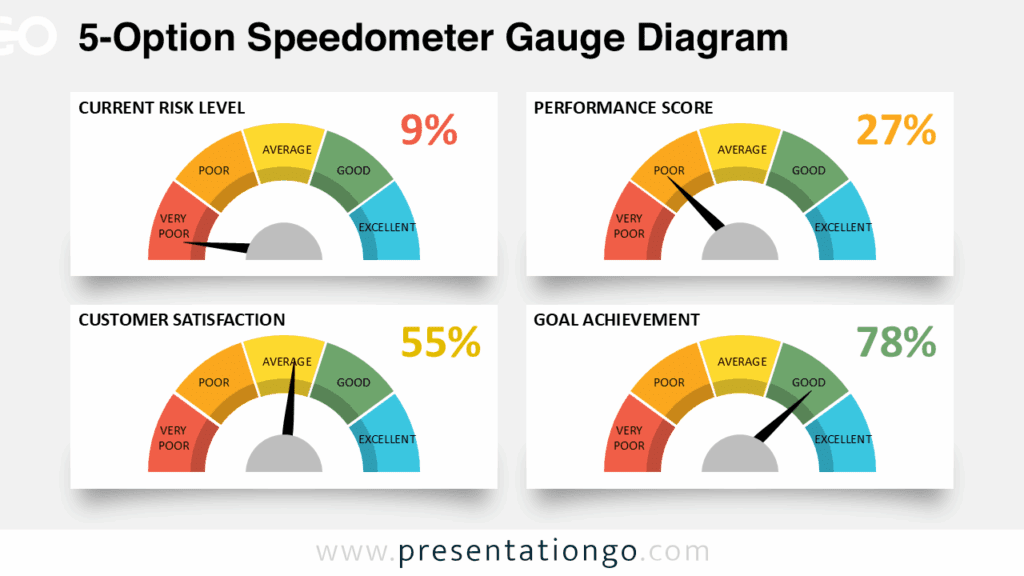
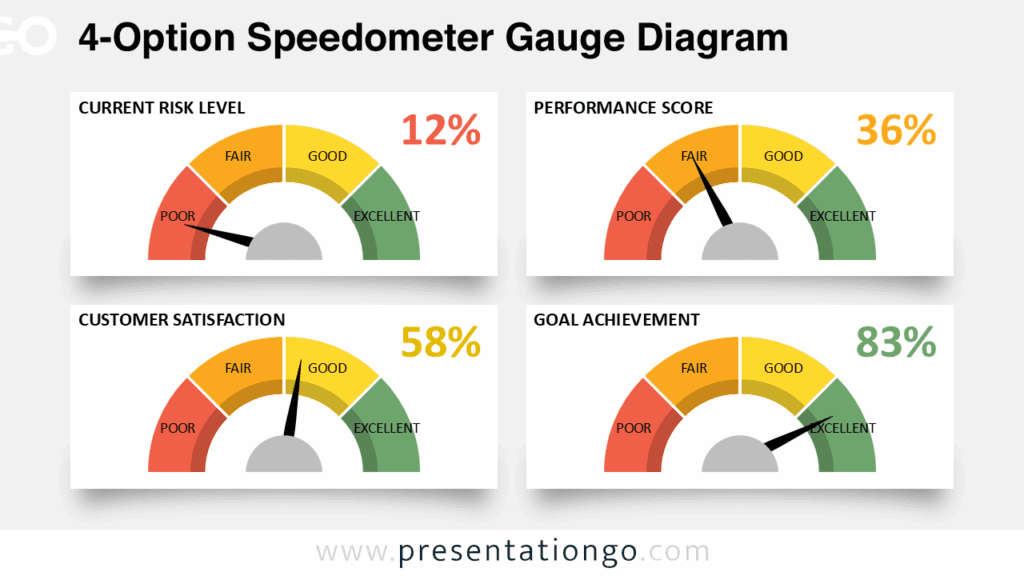
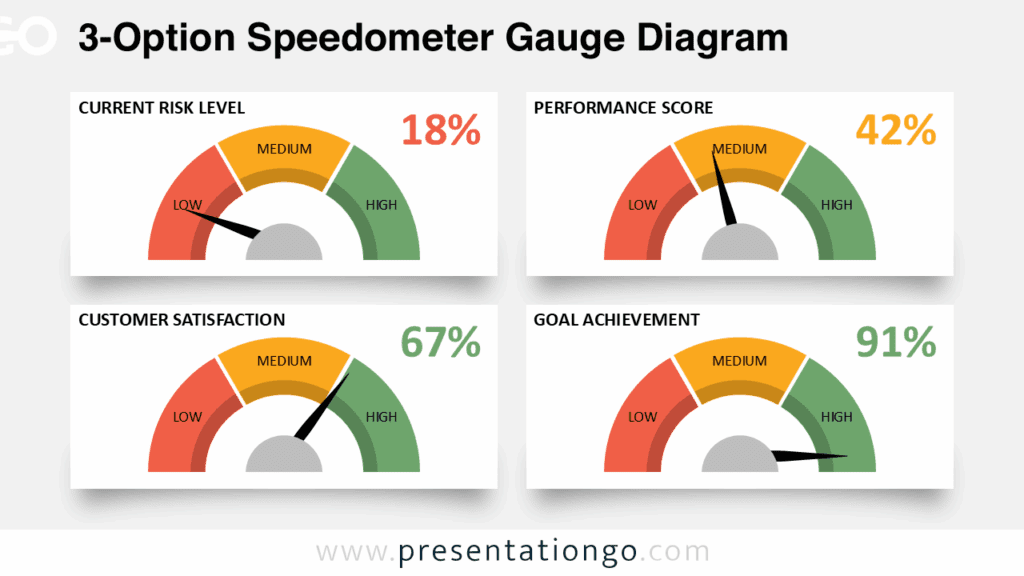
Every single slice equals 5% – for example, to illustrate a 55% score, fill 11 shapes.

Shapes are 100% editable: colors and sizes can be easily changed.
Includes 2 slide option designs: Standard (4:3) and Widescreen (16:9).
Widescreen (16:9) size preview:


This ‘Progress Pie Charts for PowerPoint and Google Slides’ features:
- 2 unique slides
- Light and Dark layout
- Ready to use template with text placeholders
- Completely editable shapes
- Standard (4:3) and Widescreen (16:9) aspect ratios
- PPTX file and for Google Slides
Free fonts used:
- Helvetica (System Font)
- Calibri (System Font)


Comments are closed.