Unlock the potential of your data with the ‘Speedometer Dashboard for PowerPoint and Google Slides’, designed to convert intricate statistics into straightforward, engaging visuals. Ideal for professionals eager to present data with precision, this template is a pivotal resource for impactful storytelling in any presentation.
Speedometer Dashboard
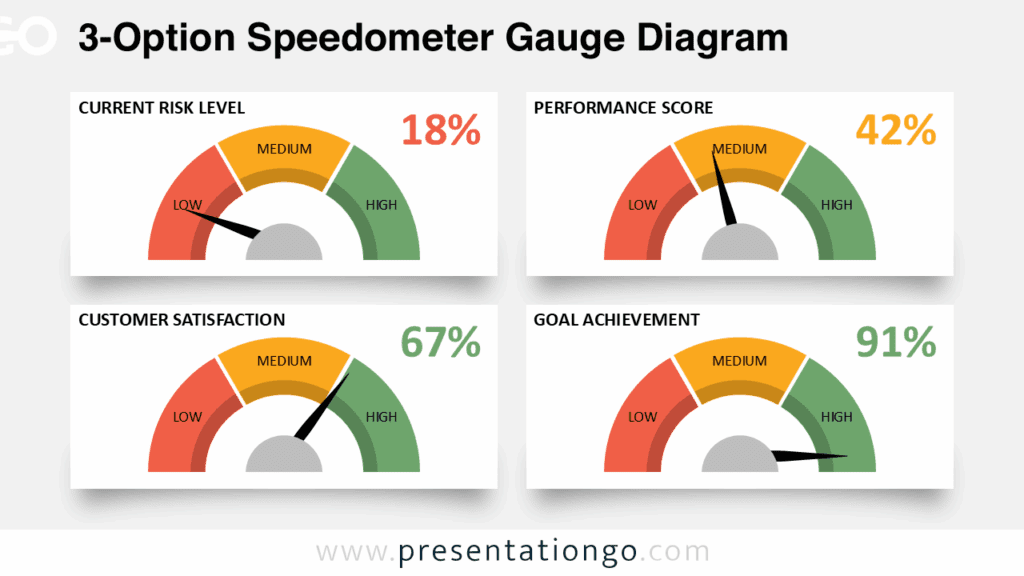
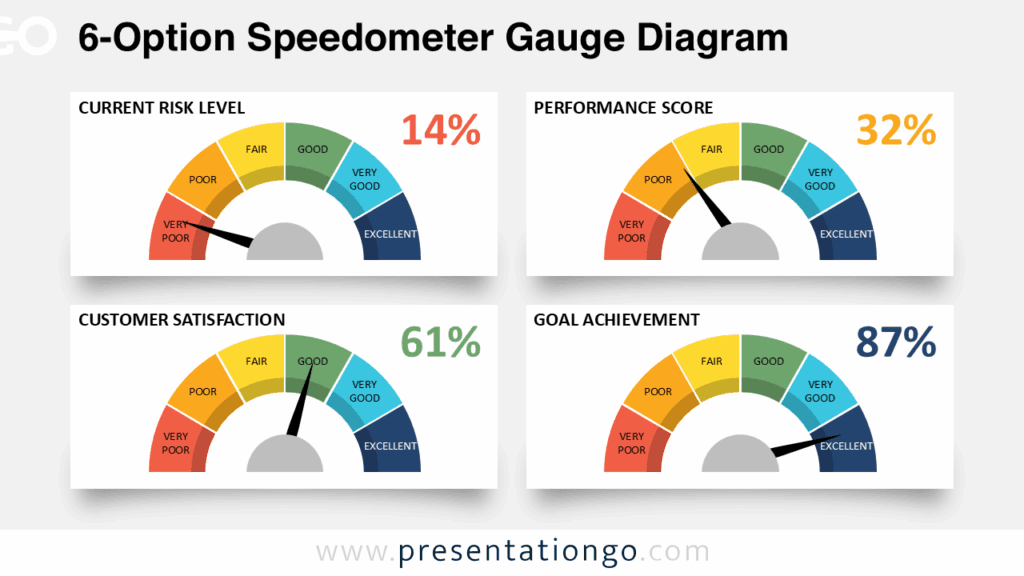
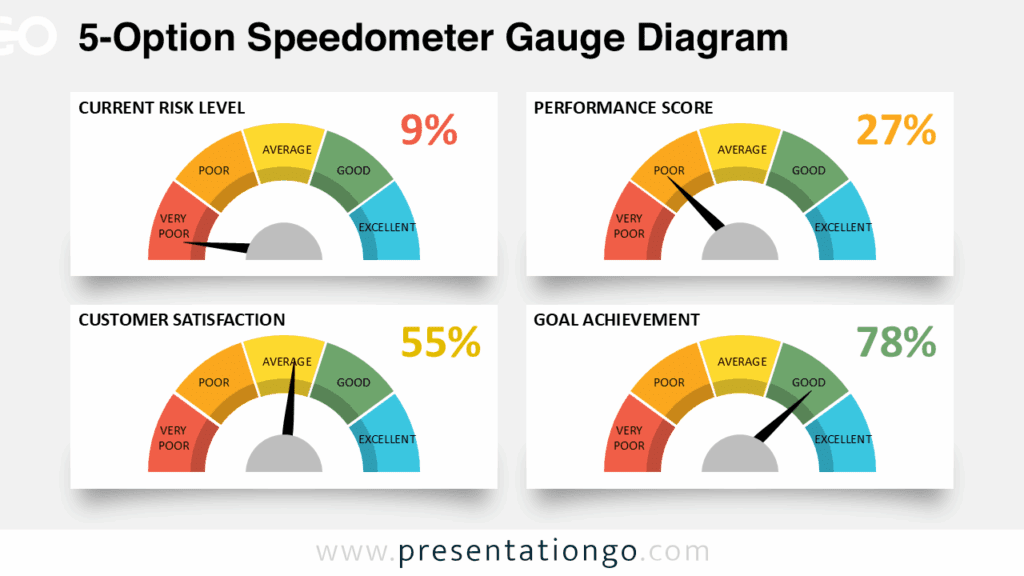
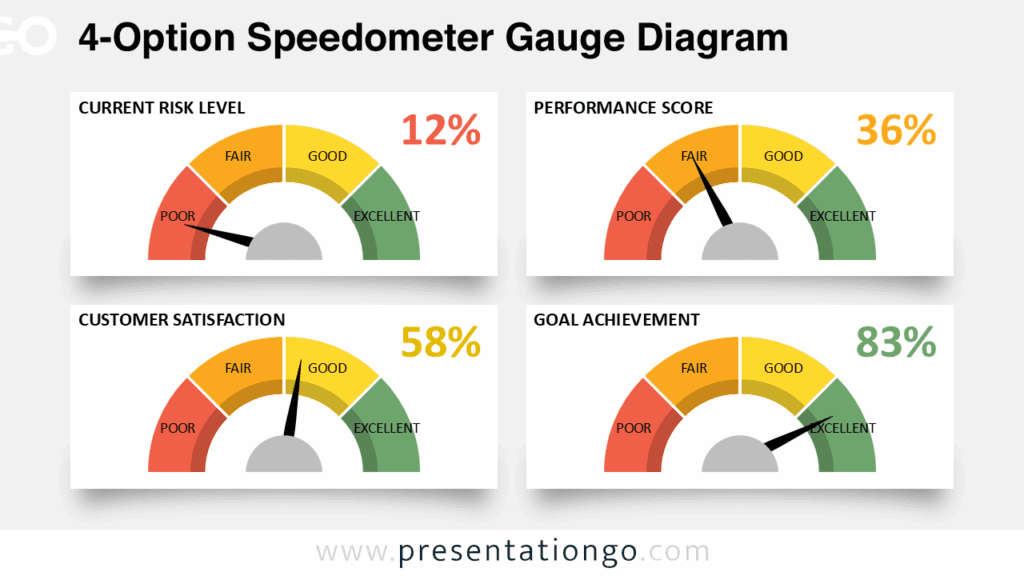
The slide template features three pie charts, each divided into ten slices, and a bold black pointer to denote percentages. The central chart, larger than the others, draws focus, while the surrounding charts support with additional data. Editable captions and numbers allow for complete customization, ensuring your data is as dynamic as your presentation narrative. The modern, minimalist design, with its vivid color palette, ensures your audience grasps the data at a glance.
The Speedometer Dashboard is an essential presentation asset across various contexts. For corporate professionals, it’s an efficient way to track and exhibit performance metrics like sales, customer satisfaction, and employee achievements. It shines in illustrating project timelines, with each speedometer marking progression toward key milestones. As a KPI Dashboard, it offers a snapshot of departmental or sectoral performance. For analysts, it simplifies comparative studies, such as regional sales comparisons or market share battles. In strategic settings, it’s instrumental for setting clear goals and later, evaluating outcomes against these targets. Educators will find it valuable for showcasing student progress across different subjects, while finance experts can use it to summarize fiscal metrics, from cost management to revenue flows. With each editable chart, complex data is transformed into intuitive, memorable visuals, optimizing both comprehension and retention.
In summation, the Speedometer Dashboard for PowerPoint and Google Slides offers a visually engaging and versatile way to represent data. It’s an asset for any presenter looking to make a persuasive argument or demonstrate findings in a memorable format. With its customizable features and suitability for both light and dark themes, it’s designed to enhance the visual storytelling of your presentation, no matter the context.
Widescreen (16:9) size preview:


This ‘Speedometer Dashboard’ template offers:
- 2 unique slides
- Light and Dark layout
- Ready to use template with text placeholders
- Completely editable shapes
- Standard (4:3) and Widescreen (16:9) aspect ratios
- PPTX file (PowerPoint) and for Google Slides
Free fonts used:
- Helvetica (System Font)
- Calibri (System Font)