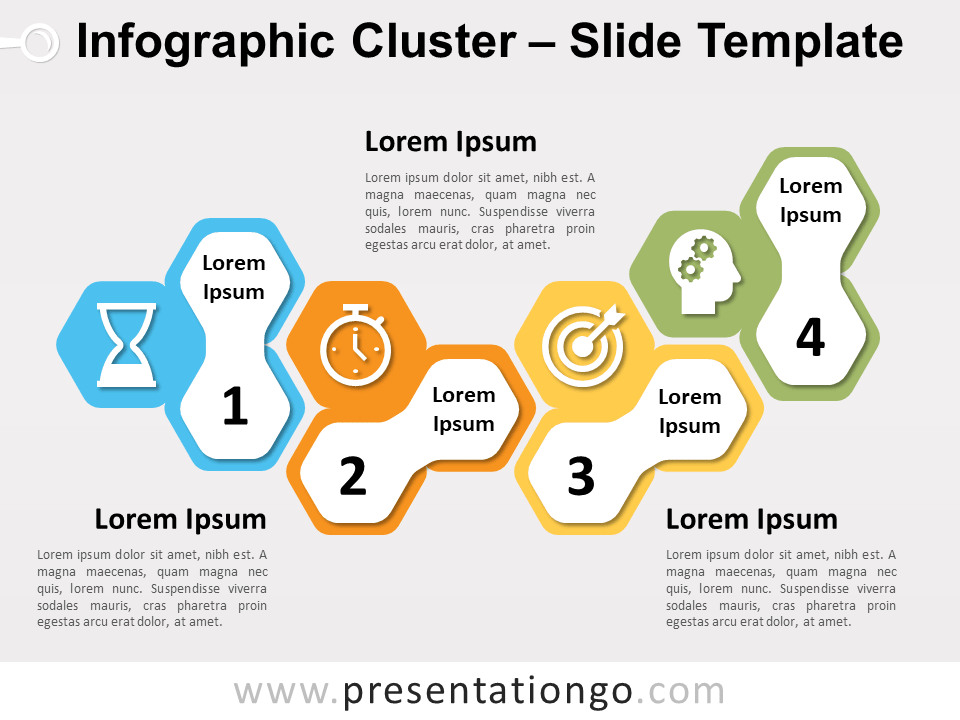
Free infographic cluster diagram for PowerPoint and Google Slides. Four elements designed with hexagons. Editable graphics with numbers, icons, and text placeholders.
Infographic Cluster
Use this infographic cluster diagram in your presentations to represent a progression or four sequential steps in a task, process, or workflow. You can also use it to show how 4 individual and interconnected parts form a whole or to illustrate 4 ideas, concepts, or groups of information.
It also can illustrate a series of events in chronological order.
Shapes are 100% editable: colors and sizes can be easily changed.
Includes 2 slide option designs: Standard (4:3) and Widescreen (16:9).
Widescreen (16:9) size preview:
This ‘Infographic Cluster for PowerPoint and Google Slides’ features:
- 2 unique slides
- Light and Dark layout
- Ready to use template with numbers, icons, and text placeholders
- Completely editable shapes
- Uses a selection of editable PowerPoint icons
- Standard (4:3) and Widescreen (16:9) aspect ratios
- PPTX file and for Google Slides
Free fonts used:
- Helvetica (System Font)
- Calibri (System Font)


Comments are closed.