Free progress bar for PowerPoint and Google Slides. Pill-shape horizontal fraction chart. Non-data-driven chart alternative. Editable graphics with text placeholders.
Progress Bar
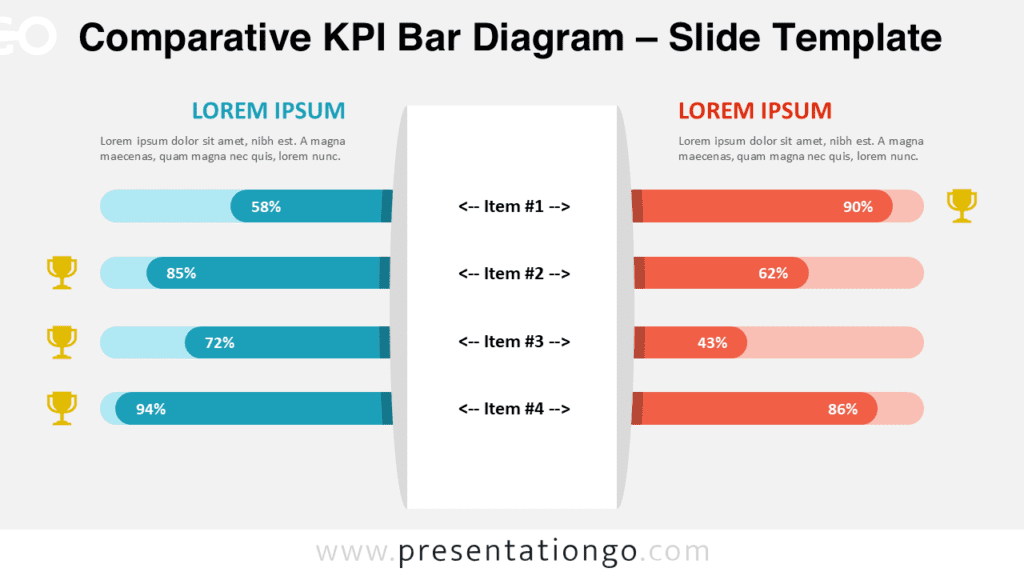
This infographic progress bar will help your audience visualize a progression.
More specifically, use this infographic chart to highlight a quantitative result of importance in a single slide. Or you can also use it as a single element of a more complex infographic slide.
Usage instructions:
Select the rounded shape with the percent, and slide them horizontally to adjust the intensity. There are 10 fractions so each level equals 10.
Shapes are 100% editable: colors and sizes can be easily changed.
Includes 2 slide option designs: Standard (4:3) and Widescreen (16:9).
Widescreen (16:9) size preview:

")
This ‘Progress Bar for PowerPoint and Google Slides’ features:
- 2 unique slides
- Light and Dark layout
- Ready to use template with text placeholders
- Completely editable shapes
- Standard (4:3) and Widescreen (16:9) aspect ratios
- PPTX file and for Google Slides
Free fonts used:
- Helvetica (System Font)
- Calibri (System Font)


Comments are closed.