
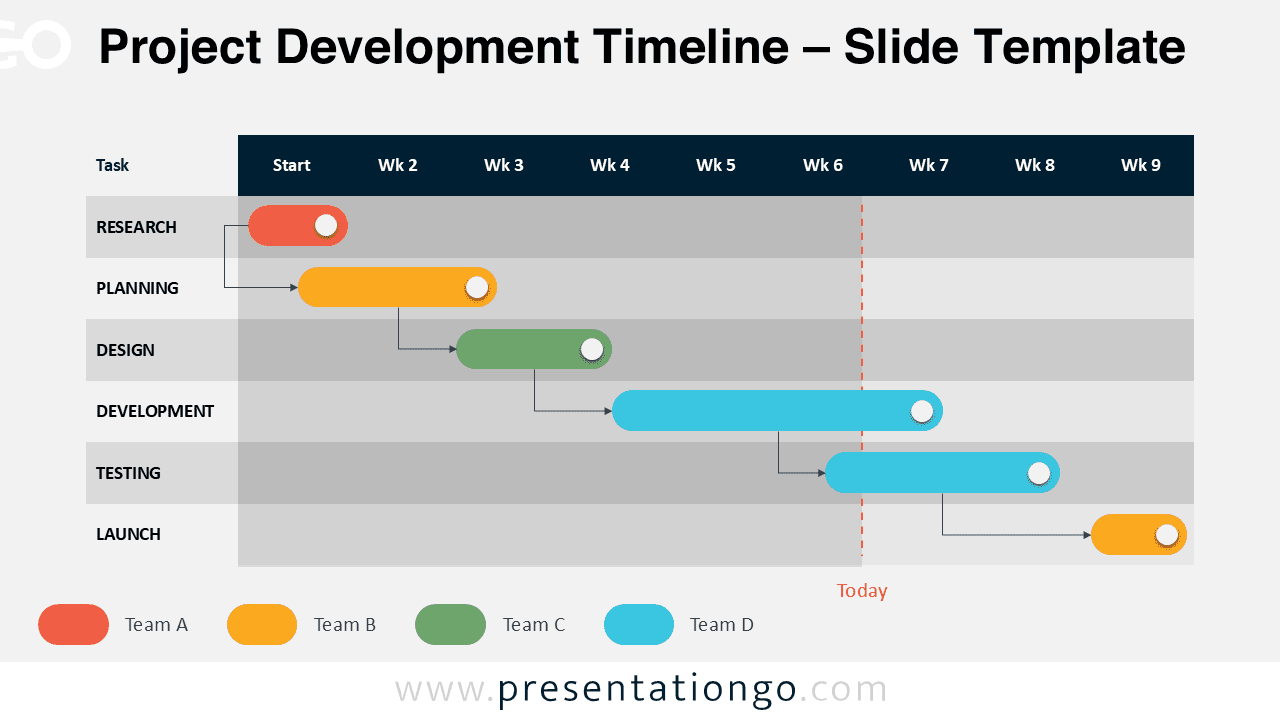
The Project Development Timeline maps out a 6-step Gantt chart process over a 9-week schedule for PowerPoint and Google Slides.
Simple Weekly Breakdown of Development Stages
This Gantt template shows a clear week-by-week breakdown of six essential phases: Research, Planning, Design, Development, Testing, and Launch. Colored horizontal bars span a 9-week grid, with each bar highlighting the duration of a task and the team in charge. Arrows connect related tasks to indicate dependencies, and a vertical red dashed line labeled “Today” helps viewers track current progress at a glance.
Presenters use Gantt charts to display project timelines, coordinate tasks, and align teams. These visuals simplify complex plans by clarifying durations, overlaps, and dependencies. In this diagram, each phase flows into the next while showing when tasks overlap. This layout supports cross-functional collaboration and enhances stakeholder understanding. It works especially well for planning meetings, product launches, and executive updates.
This template offers two slide layouts with editable shapes and a table-based design. It includes pre-filled text placeholders to speed up customization. You can use it in both PowerPoint and Google Slides, and choose from Standard (4:3) or Widescreen (16:9) formats. It’s also available in both light and dark themes.
Download this 6-step Gantt chart with timeline layout to visualize project phases, team roles, and weekly progress.
Widescreen (16:9) size preview:


This template offers:
- 2 unique slides
- Options for both light and dark themes
- Created with the Table feature – Fully customizable for complete control
- Available in both Standard (4:3) and Widescreen (16:9) ratios
- Offered in both PowerPoint PPTX and Google Slides formats



