The Project Roadmap Gantt Chart combines high-level project phases with a detailed 12-week schedule in one clear visual. Designed for PowerPoint and Google Slides, it helps presenters connect project activities with their timing without separating the roadmap from the schedule.
The upper area introduces six distinct project phases with icons, headings, and short descriptions. The Gantt chart below then shows when each task begins, how long it lasts, and how activities relate across the project timeline.
Diagram Preview
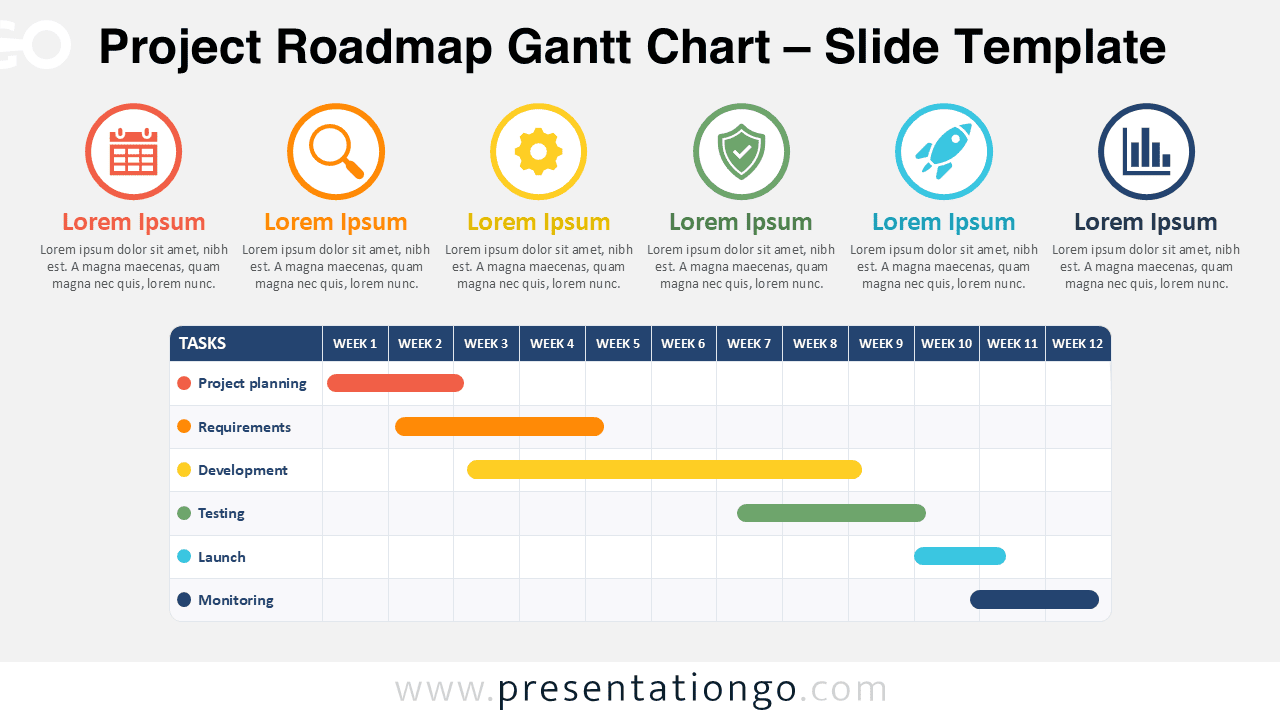
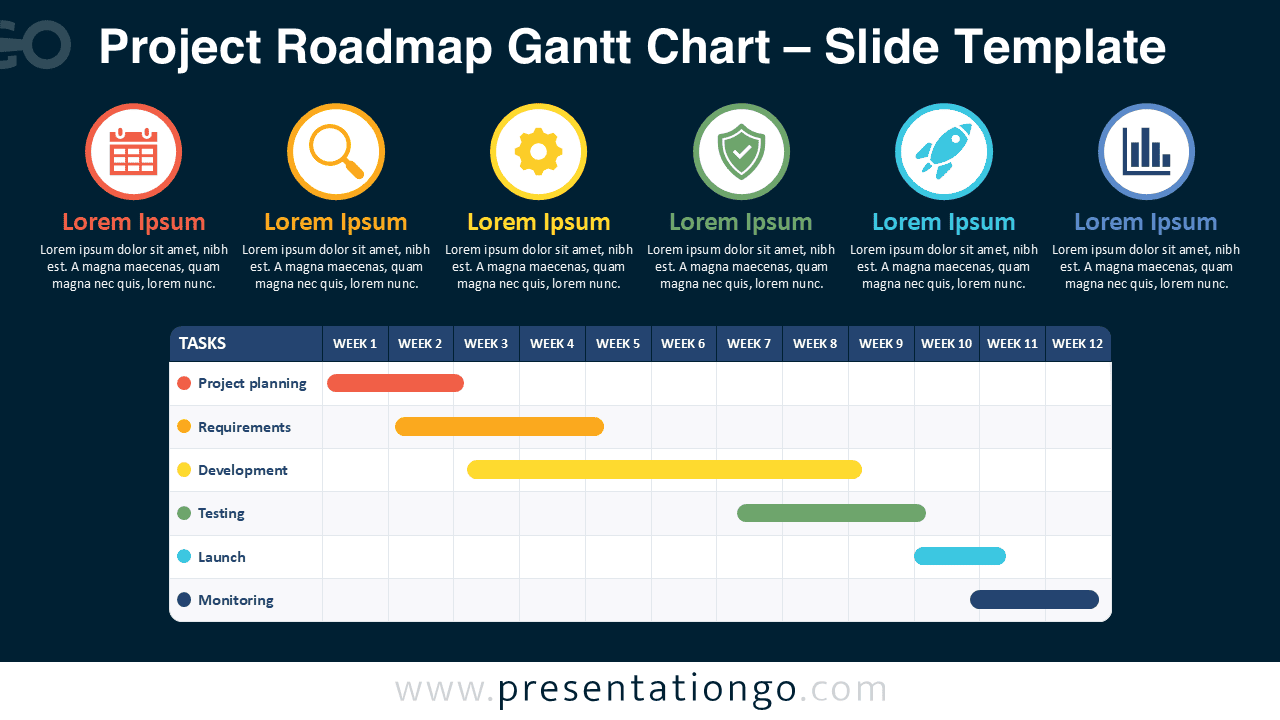


The Project Roadmap Gantt Chart gives viewers two levels of information at once. The phase summaries provide quick context, while the timeline offers a more precise view of task duration and sequence. This structure works especially well when a project needs both an executive overview and a practical schedule.
The diagram includes six task rows and a 12-week planning range. You can adapt the text, resize the elements, and move the Gantt bars to reflect a different project schedule or workflow.
Features and Customization Options
- Compatible with Microsoft PowerPoint and Google Slides
- Editable Gantt bars — drag to reschedule
- Editable text, shapes, and icon placeholders
- Office library icons for illustration purposes only and easy modification
- Includes both light and dark background versions
Design and Structure
The layout separates strategic project information from scheduling details while keeping both parts visually connected. Six phase blocks sit across the top, with each one pairing an icon, heading, and supporting text. This gives presenters room to explain the purpose of each stage before moving into timing.
The Gantt chart uses clearly defined task rows and weekly columns, making durations and overlaps easy to follow. Rounded timeline bars keep the schedule readable without adding unnecessary visual complexity. The result feels structured enough for project management while remaining accessible to a broader business audience.
Practical Applications
- Project planning and scheduling
- Product launch roadmaps
- Software implementation plans
- Marketing campaign timelines
- Operational project reviews
- Milestone and task tracking
- Stakeholder progress presentations
- Team planning meetings
Summary
The Project Roadmap Gantt Chart brings project phases and schedule details into a single presentation-ready diagram. It provides enough structure for formal planning while staying flexible for different industries, teams, and project types.
Use it when you need to explain what happens during each phase and when that work takes place. Editable Gantt bars, text, shapes, and Office library icons make the slide straightforward to adapt in both PowerPoint and Google Slides.