Free stacked folders chart for PowerPoint and Google Slides. Stacked folders or books to show quantitative results. Editable graphics with percentage and text placeholders.
Stacked Folders Chart
Pile up your files and share your numbers with your audience! This free Stacked Folders Chart template is a great visual metaphor to clearly show your quantitative results.
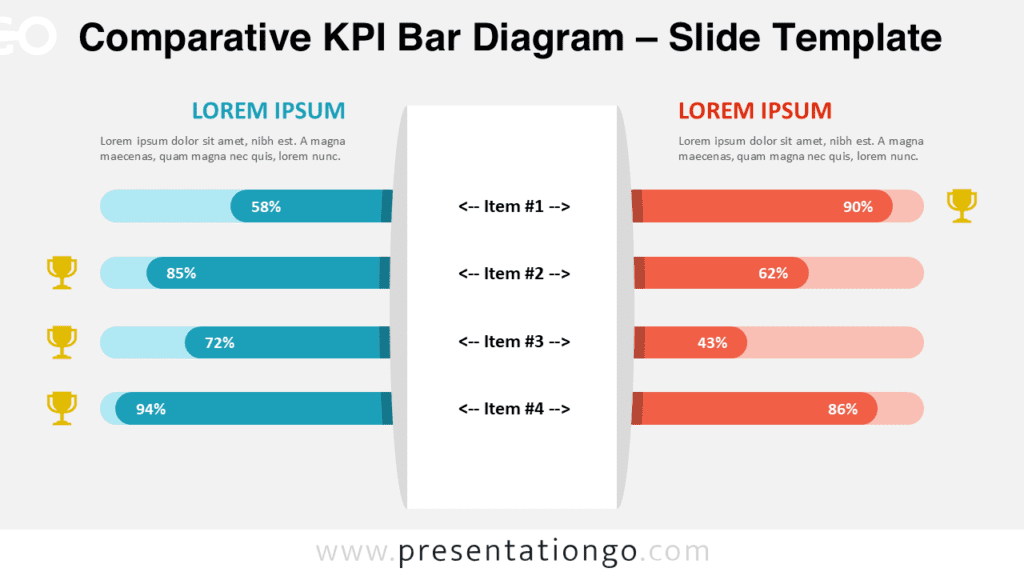
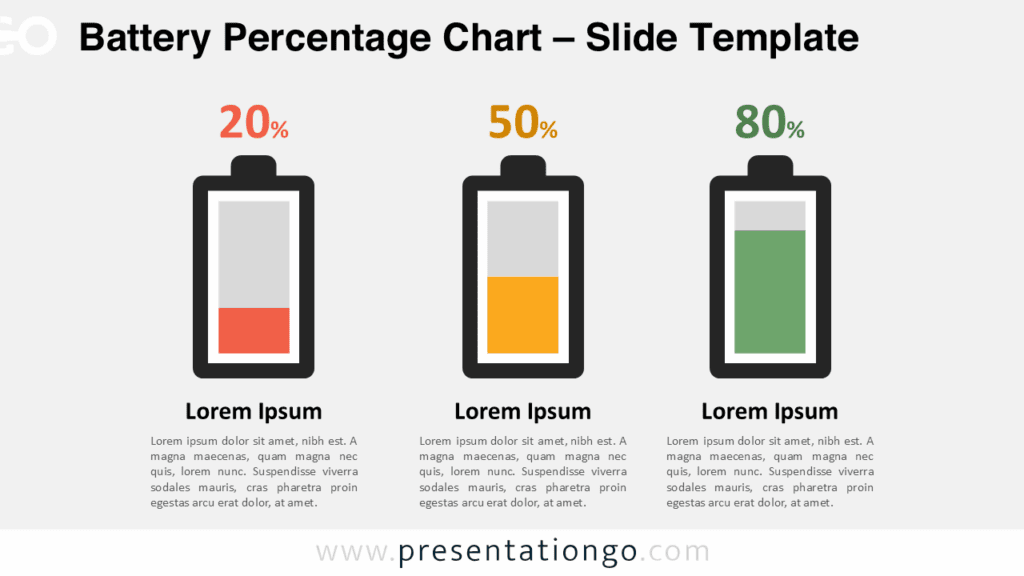
This infographic slide displays three columns made of stacked folders or books with distinct colors. Each column can represent a number or percentage. You can also write the exact figure above every pile if you wish to do so. For instance, you can decide that each folder represents 10% or a specific amount. Besides, you will find text placeholders below to explain your results in writing.
This free Stacked Folders Chart template is a perfect metaphor for work-related numbers, account books, or file processing. These column charts are ideal for quantitative results and number comparisons.
Shapes are 100% editable: colors and sizes can be easily changed.
Includes 2 slide option designs: Standard (4:3) and Widescreen (16:9).
Widescreen (16:9) size preview:


This ‘Stacked Folders Chart’ template features:
- 2 unique slides
- Light and Dark layout
- Ready to use template
- Completely editable shapes
- Standard (4:3) and Widescreen (16:9) aspect ratios
- PPTX file (PowerPoint) and for Google Slides
Free fonts used:
- Helvetica (System Font)
- Calibri (System Font)