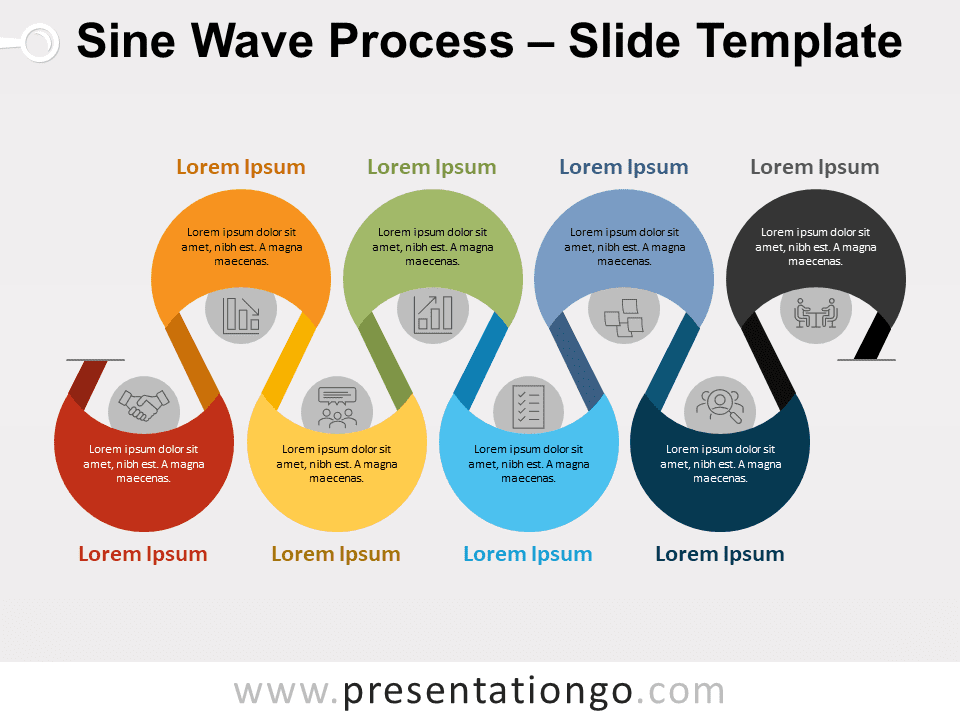
Free sine wave process for PowerPoint and Google Slides. A snake-shaped diagram with 8 crescents or options. Editable graphics with icons and text placeholders.
Yet Another Sine Wave Process
Do you want to show an 8-step process in a clear, colorful, and creative manner? Using this free Sine Wave Process will be like waving a magic wand!
This chart represents an alternating process with 8 options. You can indeed illustrate 8 stages: every single one is represented by a semi-circle (each one with a different color) which forms part of this serpentine horizontal design. You can insert a title for each step and a short text inside each semi-circle (or crescent). Besides, you will find 8 little gray circles to represent your steps with an icon (or a number).
This snake-shaped chart is ideal to represent 8 sequential steps in a process, progression, or workflow. It allows you indeed to clearly show all the connections and conversions of your process. You can also use this free Sine Wave Process template as a timeline.
Shapes are 100% editable: colors and sizes can be easily changed.
Includes 2 slide option designs: Standard (4:3) and Widescreen (16:9).
Widescreen (16:9) size preview:
This ‘YA Sine Wave Process for PowerPoint and Google Slides’ features:
- 2 unique slides
- Light and Dark layout
- Ready to use template with icons and text placeholders
- Completely editable shapes
- Uses a selection of editable PowerPoint icons
- Standard (4:3) and Widescreen (16:9) aspect ratios
- PPTX file and for Google Slides
Free fonts used:
- Helvetica (System Font)
- Calibri (System Font)


