Latest Templates
Discover our vast, continually growing collection of free, high-quality, customizable templates & Infographics for PowerPoint and Google Slides presentations, designed to enhance your visual communication.

Quadrilateral Cycle Diagram for PowerPoint
Square shape made with 4 bent arrows, in a circular flow.
PPTX
4:316:9

Triangle Cycle Diagram for PowerPoint
Triangular shape made with 3 bent arrows, in a circular flow.
PPTX
4:316:9
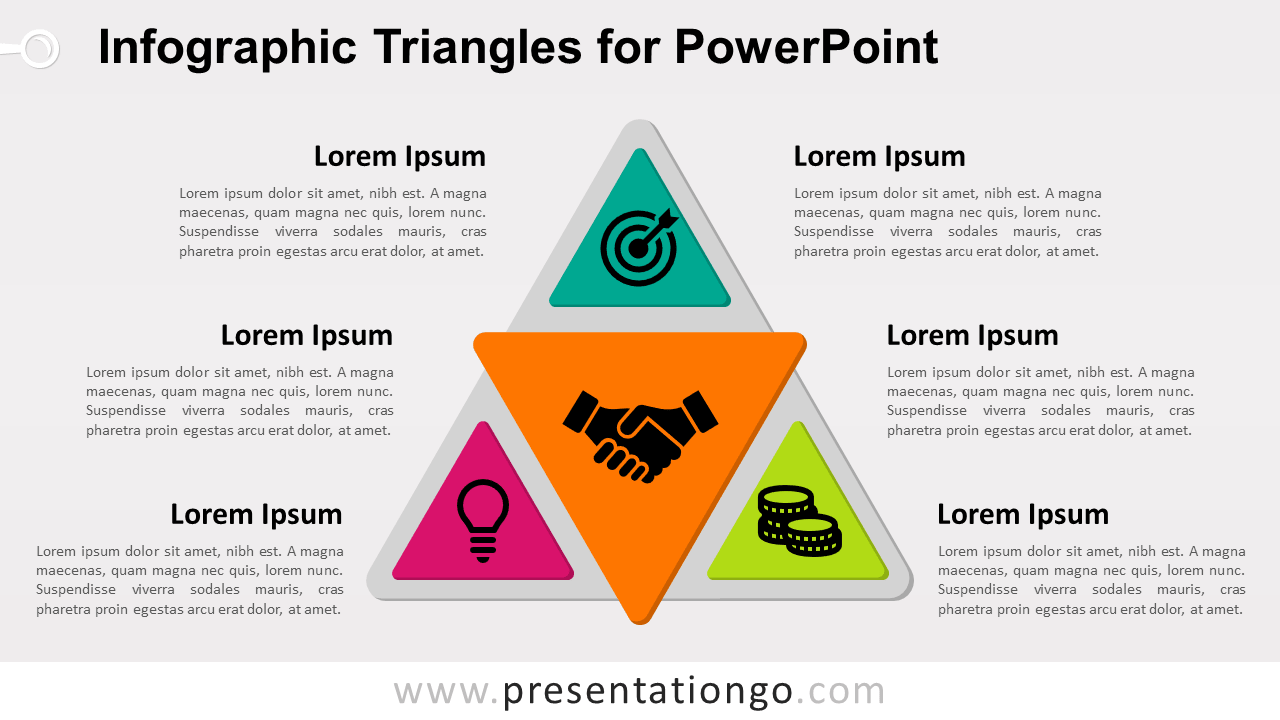
Infographic Triangles for PowerPoint
A segmented pyramid shape made with 4 triangular faces.
PPTX
4:316:9

Infographic Funnel with 4 Stages for PowerPoint
An inverted cone with 4 colored layers.
PPTX
4:316:9


Strategy Diamond for PowerPoint
Strategic model about the five arenas, differentiators, vehicles, staging, and economic logic.
PPTX
4:316:9

Wavy Pricing Table for PowerPoint
Set of pricing comparison tables, with a wavy effect for the colored headers and icons for each type of the 4 plans.
PPTX
4:316:9

Up Arrows Diagram for PowerPoint
5 colored upwards and bent arrows, like a water fountain.
PPTX
4:316:9
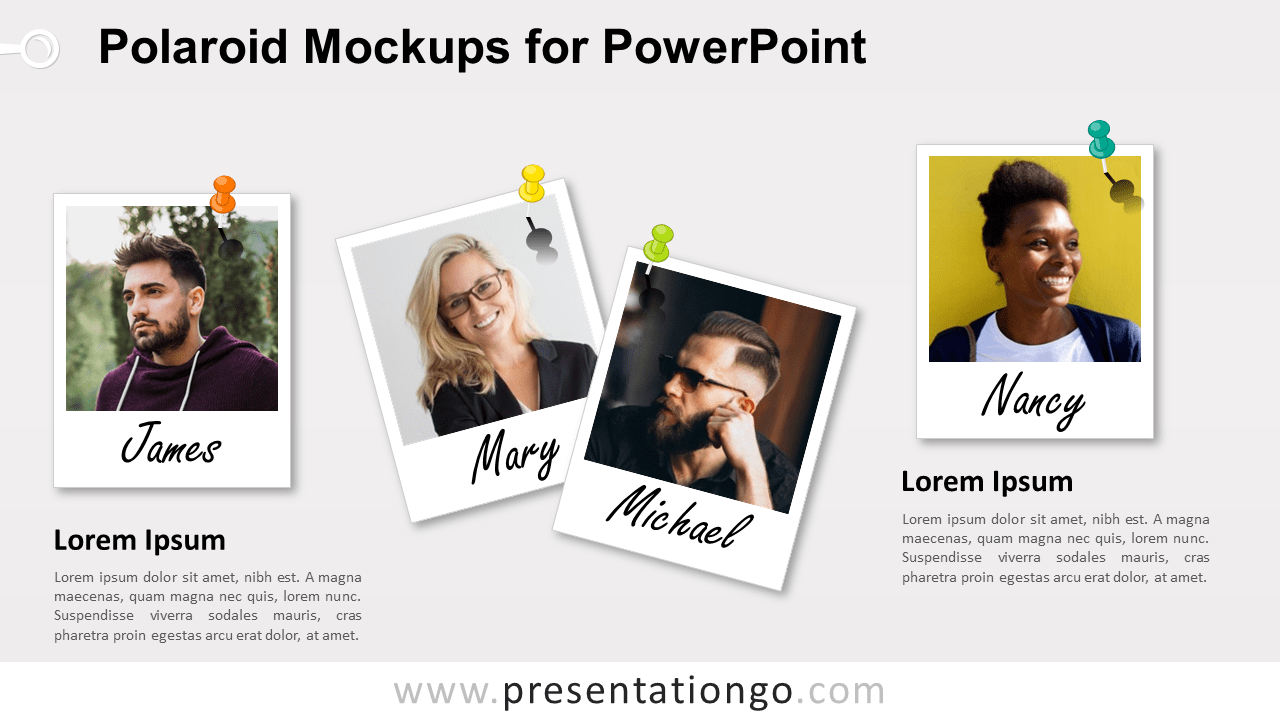
Polaroid Mockups for PowerPoint
4 lined-up Polaroid frames with different orientations, and push pins.
PPTX
4:316:9
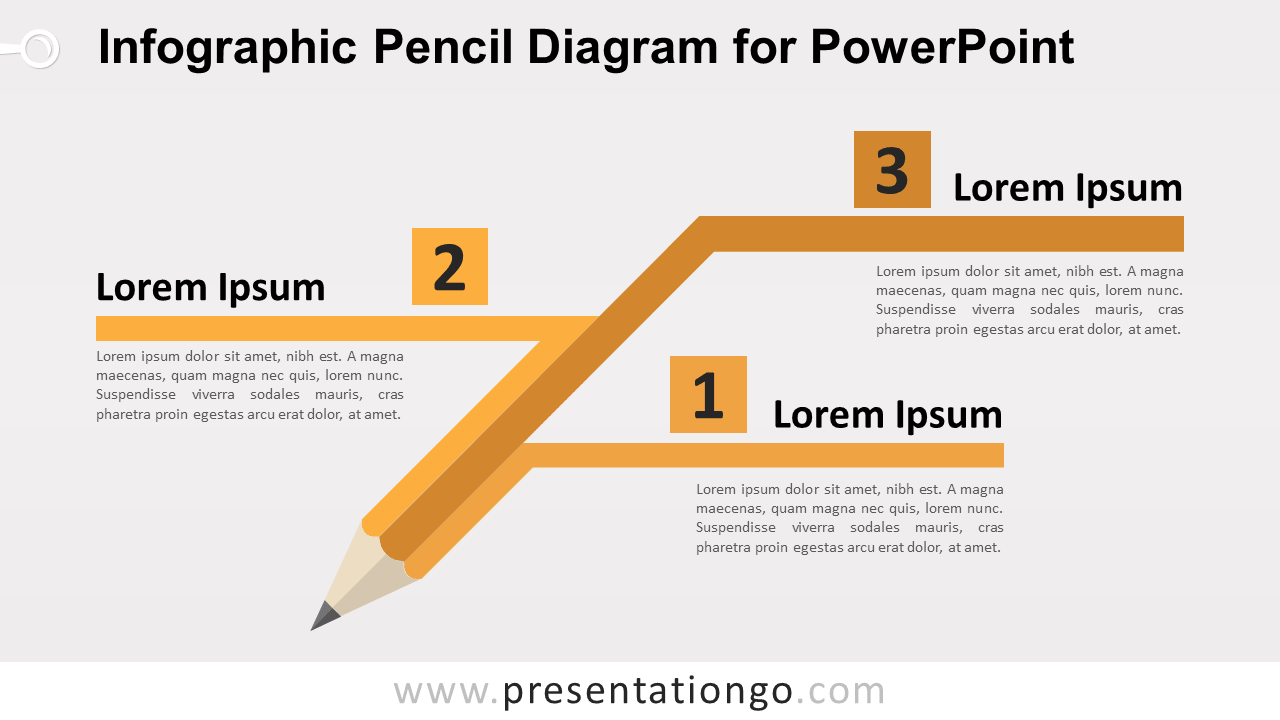
Infographic Pencil Diagram for PowerPoint
Design illustration of a diagonal graphite pencil with 3 levels.
PPTX
4:316:9

Bar Chart with Cars for PowerPoint
Data-driven clustered bar chart with colored cars on the edge of each horizontal bars.
PPTX
4:316:9
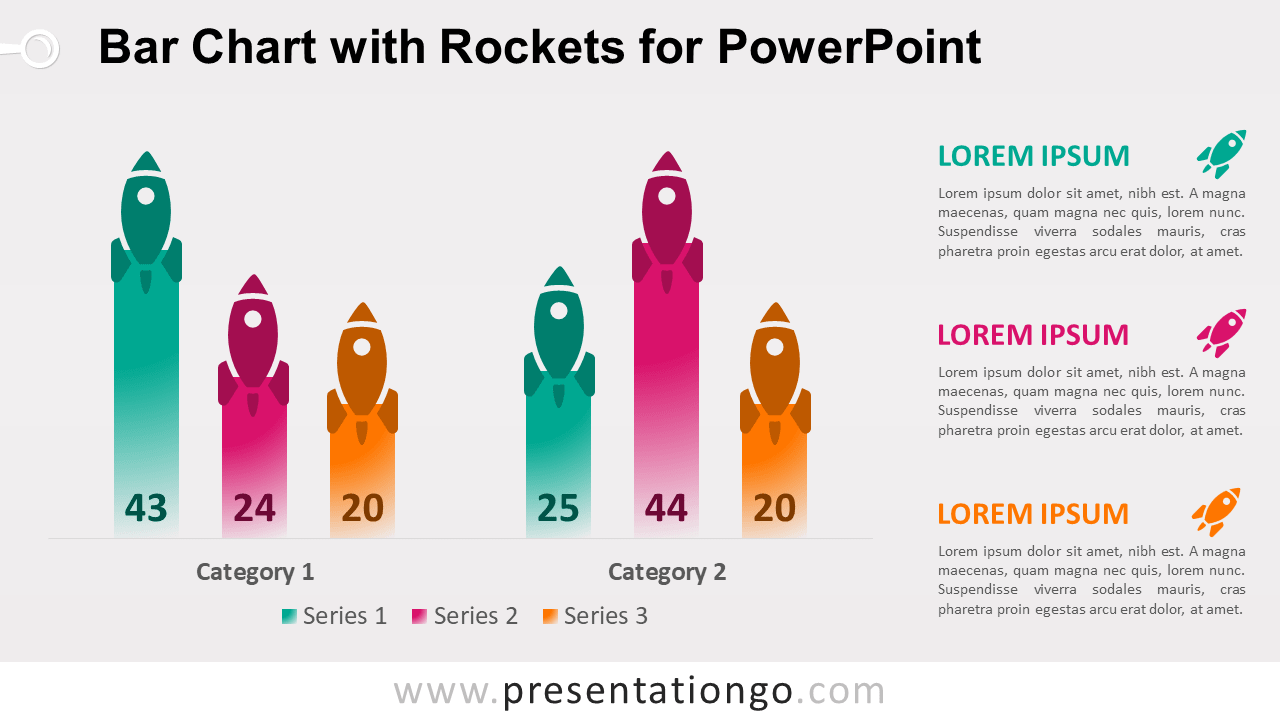
Bar Chart with Rockets for PowerPoint
Data-driven clustered-column bar chart with colored rockets on top of each bars.
PPTX
4:316:9
