This Battery Percentage Chart for PowerPoint is a fully data-driven visual tool designed to represent progress, performance, or capacity levels with clean and modern battery graphics. Each battery shape is linked to an editable value, making it easy to adjust the fill height by updating the underlying data. This ensures precise customization without manually repositioning shapes, allowing you to adapt the chart quickly to any context or measurement scale.
Diagram Preview
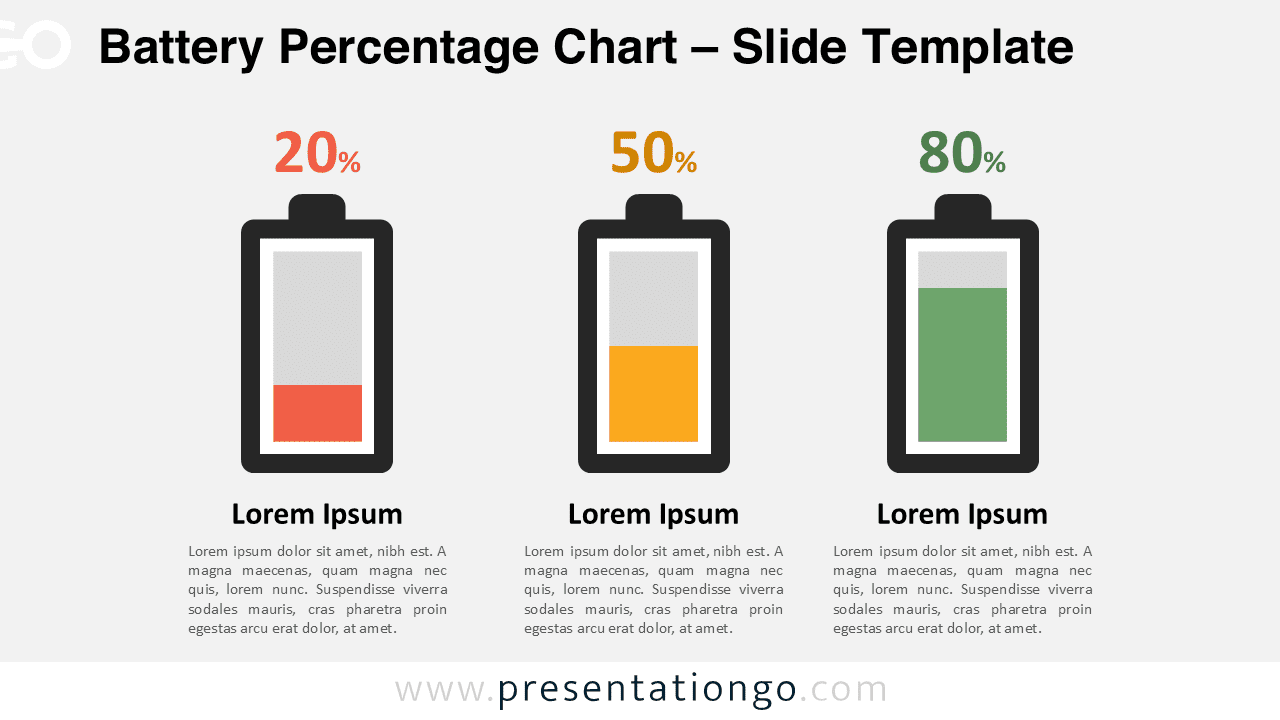
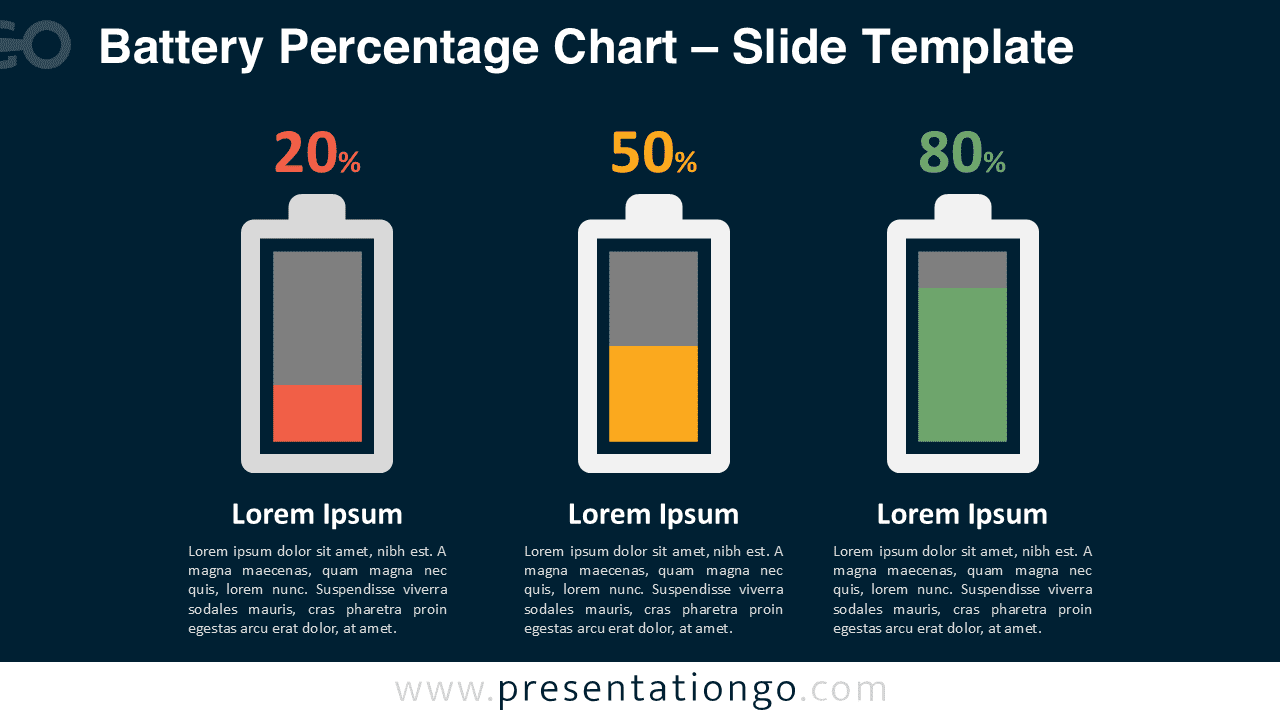
Diagram Features and Customization Options
- Data-driven battery shapes that automatically adjust fill height
- Editable colors, outlines, and text for personalized formatting
- Clean three-part layout ideal for comparing multiple values
- Perfect for dashboards, progress indicators, and performance reporting
- Easy to resize while maintaining precise proportions
- Designed exclusively for PowerPoint
Design and Structure
The layout presents three battery visuals arranged side by side, each representing a different value or stage. The design emphasizes clarity and readability through a simple vertical structure and a consistent color progression. All components are vector-based, ensuring smooth scaling and crisp visuals at any size. Two theme variations are included: a bright layout suitable for clean corporate slides and a dark layout offering stronger contrast for more dynamic presentations.
Because the batteries use a data-driven structure, updating values is quick and precise. Instead of adjusting shapes manually, you can enter the desired values into the editable fields, and the battery fill adjusts instantly. This makes the diagram ideal for recurring reporting or scenarios where values need frequent updates. Every text element, color, and shape is customizable, allowing you to match your presentation branding effortlessly.
Practical Applications
- Progress reporting and tracking
- Performance comparisons for projects or teams
- Business dashboards and status summaries
- Capacity and resource monitoring
- Technical or operational presentations
Summary
This data-driven Battery Percentage Chart for PowerPoint offers a fast and accurate way to visualize progress, performance, or capacity. With editable values driving the battery fill levels, updates are simple, consistent, and precise. Whether used in dashboards, planning sessions, or performance reports, this diagram brings clarity and modern visual appeal to any slide.
Frequently Asked Questions (FAQ)
Yes. Because the chart is data-driven, updating the numeric values in the editable fields changes the fill height instantly while keeping the layout, alignment, and proportions intact.
To adjust the battery levels, select the chart element, right-click, and choose “Edit Data.” A small Excel window will appear. Enter your new values in the spreadsheet, and the battery fills automatically adjust to match the updated data.