Planning a full year of initiatives requires a clear and structured visual timeline. The Annual Project Gantt Chart for PowerPoint and Google Slides helps you present project schedules, milestones, and development phases in a simple and professional way.
This diagram is designed to visualize projects that span an entire year. Tasks appear as horizontal bars distributed across months, allowing audiences to quickly understand timelines, progress, and dependencies. The layout is ideal for business planning, product development roadmaps, and strategic project presentations.
Diagram Preview
Features and Customization Options
- Fully editable Gantt chart layout
- Annual timeline covering January to December
- Quarter indicators (Q1–Q4) for clear time segmentation
- Task bars showing project phases and durations
- Progress indicators and percentage completion values
- Project categories such as strategy, design, development, testing, and launch
- Dashboard-style summary metrics for project tracking
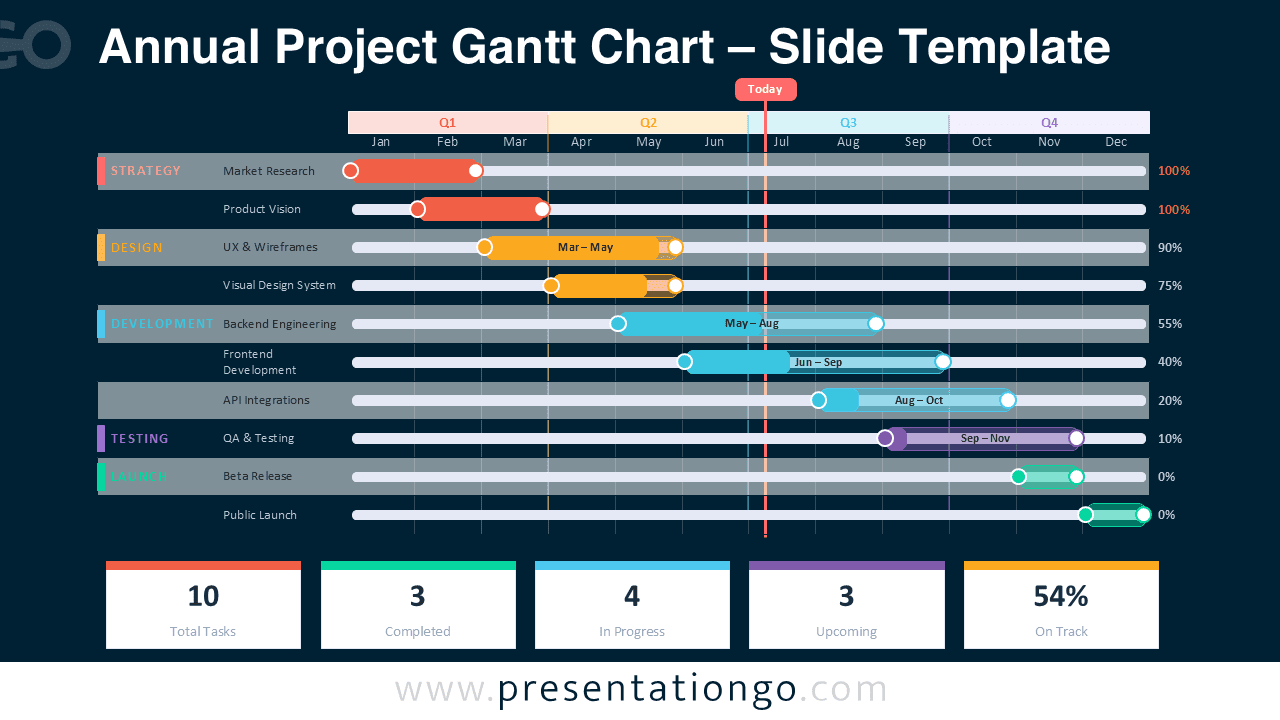
- Two slide versions included: light and dark themes
- Compatible with PowerPoint and Google Slides
Design and Structure
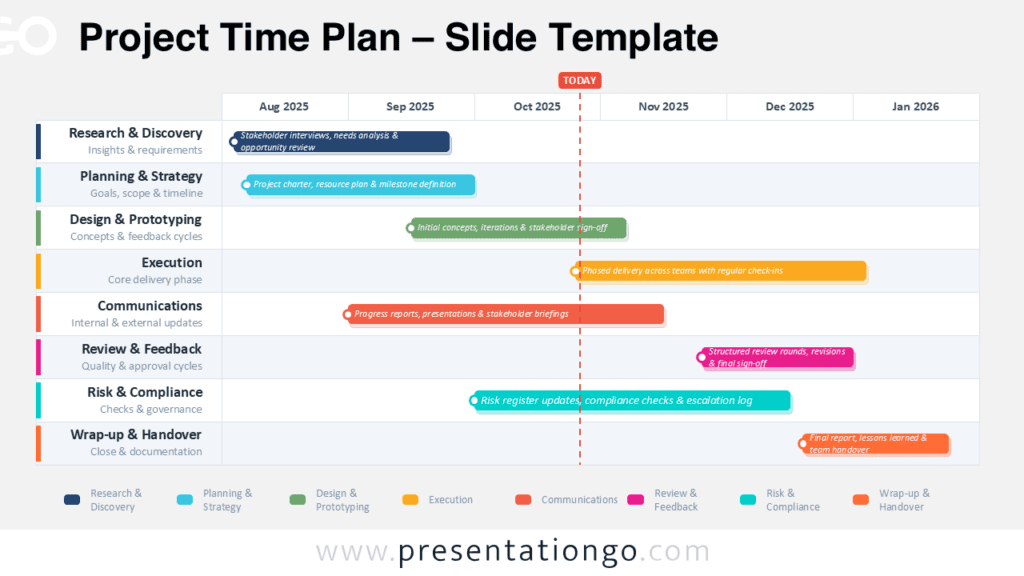
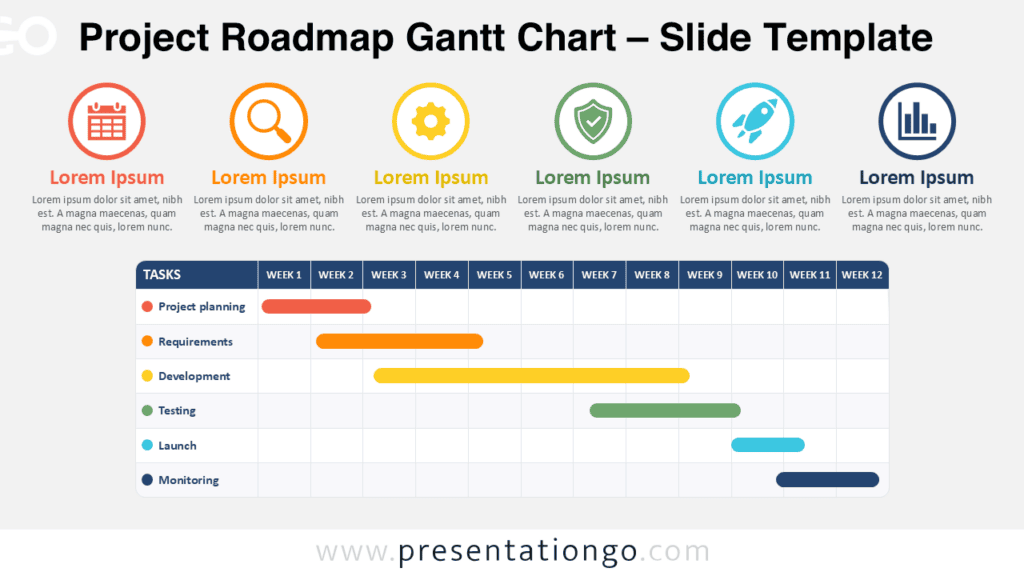
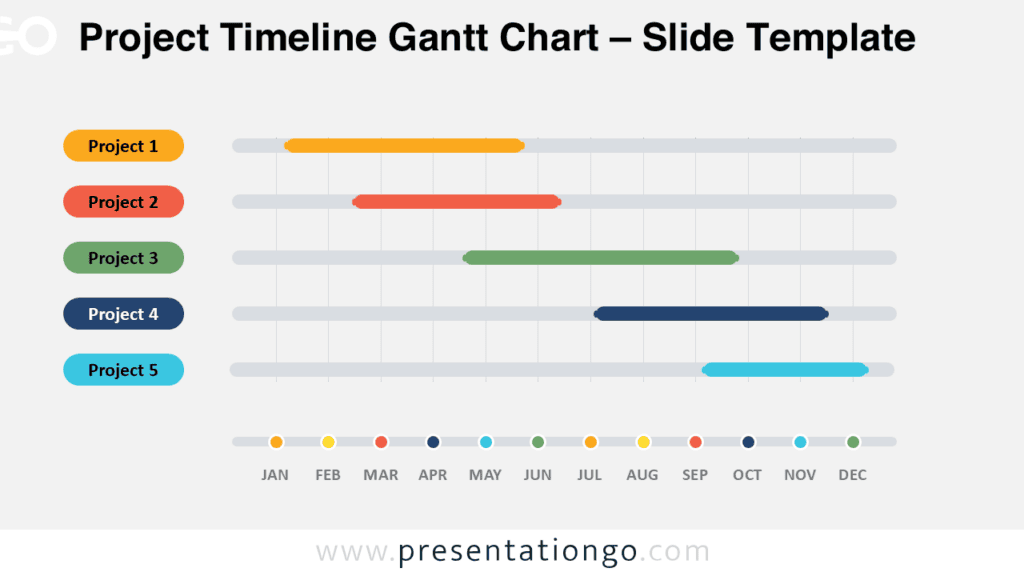
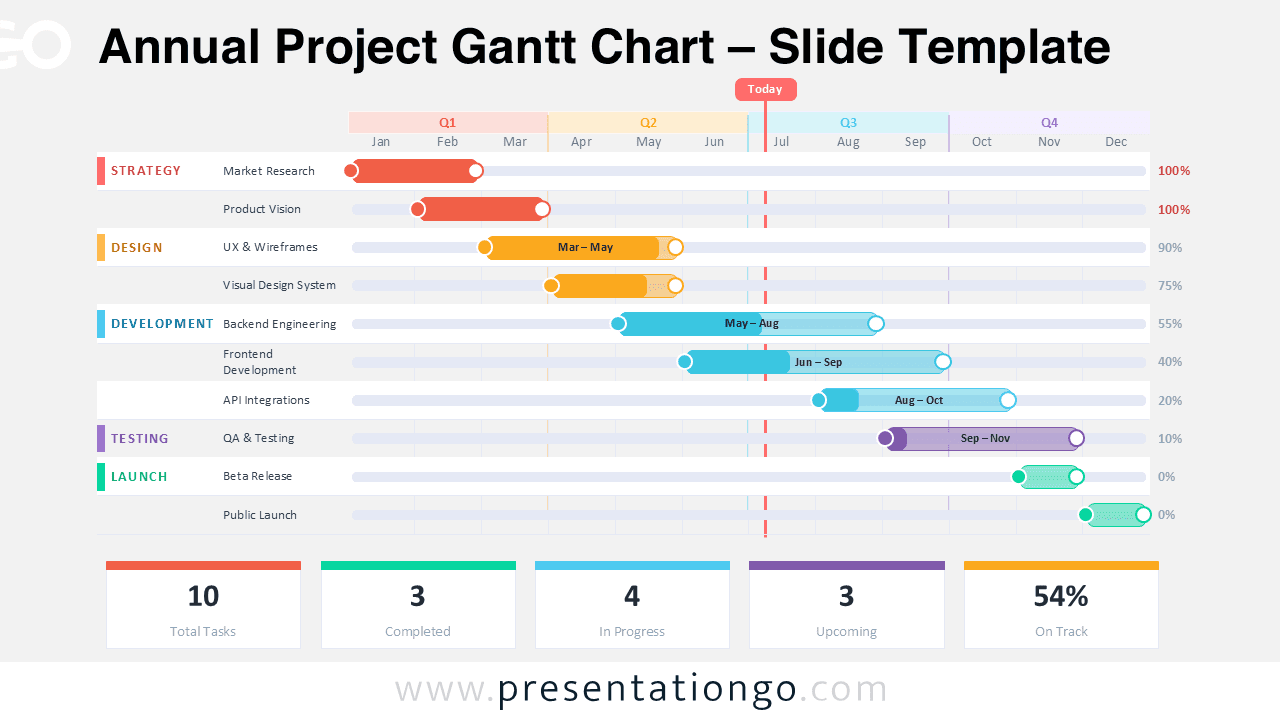
The diagram follows a structured Gantt chart format that organizes tasks across a calendar-based timeline. Months run horizontally across the top of the slide, while project phases appear as grouped rows on the left side. Each task is represented by a colored bar that highlights the start and end dates of the activity.
Distinct color accents help differentiate major project phases such as strategy, design, development, testing, and launch. A vertical marker labeled “Today” allows presenters to indicate the current progress point within the yearly roadmap.
At the bottom of the slide, summary indicators provide a quick dashboard overview of project performance, including total tasks, completed activities, tasks in progress,
upcoming items, and overall progress.
Practical Applications
- Annual project planning presentations
- Product development roadmaps
- Program and portfolio management updates
- Startup product launch timelines
- Strategic initiative tracking
- Agile release planning over a yearly schedule
- Executive project status presentations
Summary
The Annual Project Gantt Chart diagram provides a clear visual structure for presenting year-long project timelines. With editable task bars, structured phases, and dashboard metrics, it helps teams communicate project progress and future milestones effectively. Use it to deliver more organized and visually compelling planning presentations in PowerPoint or Google Slides.