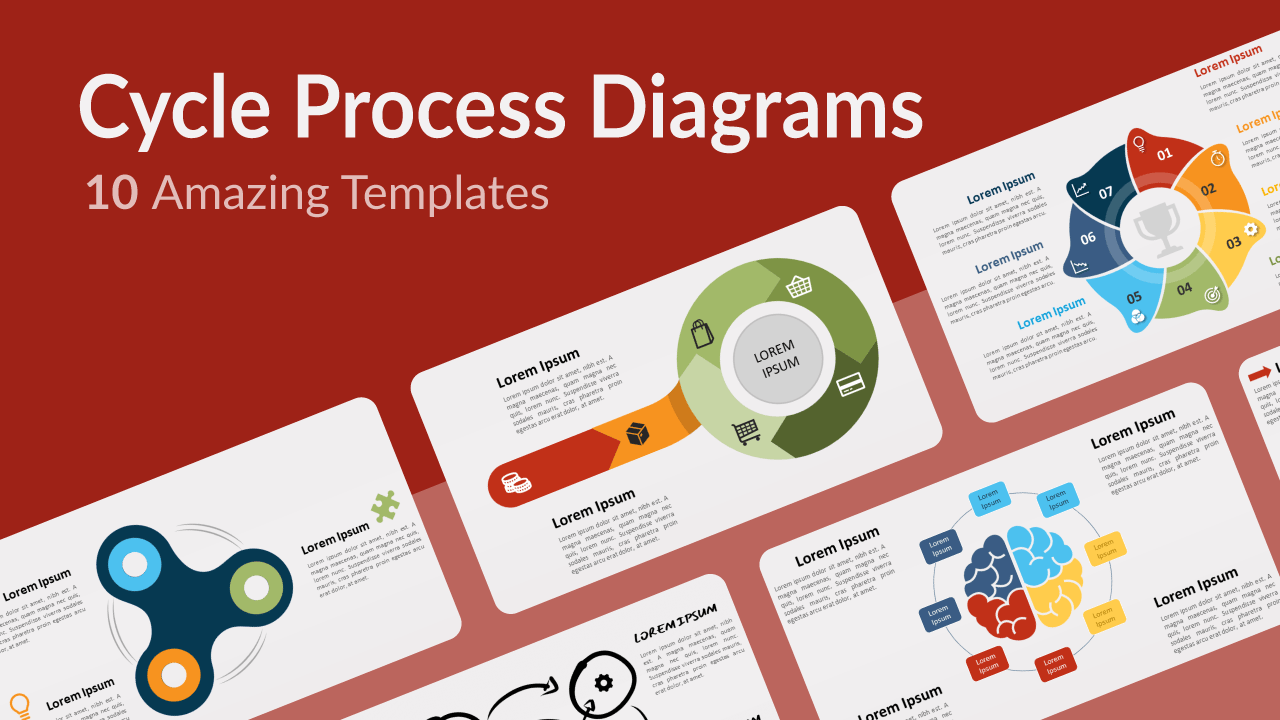
“Nothing is lost, nothing is created, everything is transformed”, said the French chemist Antoine Lavoisier. This sentence explains the cycle of matter, thus the cycle of life itself. When we take a close look at phenomena and processes, we realize a lot of them are cyclical. Indeed, steps and events tend to repeat themselves endlessly. To represent such circular progressions to your audience, you need clear, attractive, and original infographics. This is exactly what we offer you here: 10 free amazing cycle process diagrams for PowerPoint and Google Slides!
When you wish to explain a repeating process, your oral explanation may not be enough. A clear, strong visual aid will ensure a greater understanding. These original cycle diagrams templates allow you to illustrate a great number of processes: money flow, product life cycles, production processes, the life cycle of a business idea, and even timelines or roadmaps of steps to follow. These circular charts can fit any purpose, as long as the last step is linked to the first step.
The 10 astounding templates below will fit all your needs. You will indeed find charts from 3 to 8 steps, in color or black and white, with small or large text placeholders, with or without numbers, icons, and arrows. Make your choice and enter the virtuous circle of successful presentations!
1. Horn Cycle with 7 Parts
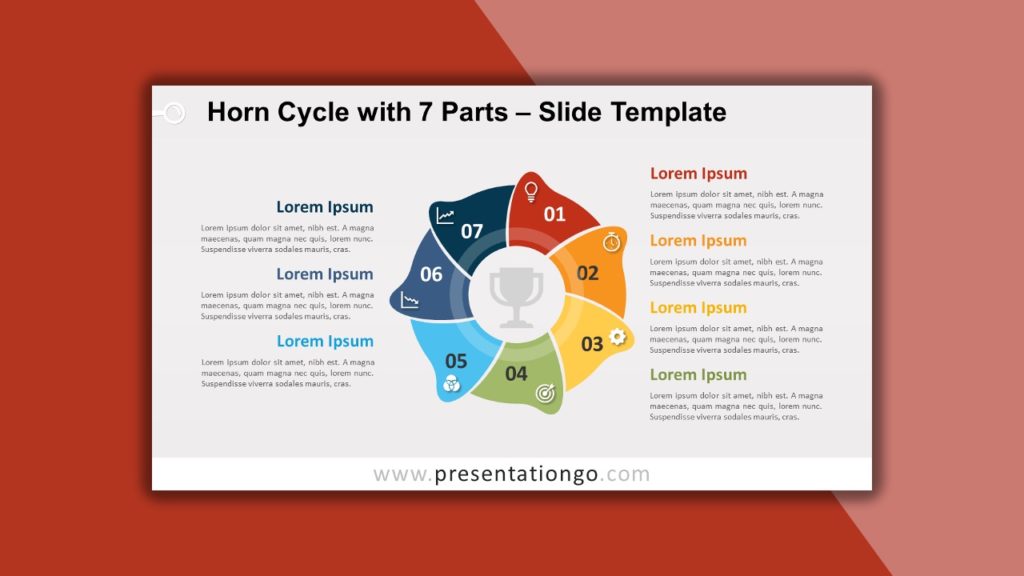
Why not trade the classical circular diagram with arrows for a more original option? Thanks to this free Horn Cycle chart, your audience will hear your message loud and clear! The seven interlocked horn shapes create a dynamic diagram with a circular flow. It is therefore ideal for a cycle process with 7 stages, tasks, or events but may also be used as a radial chart. You can indeed show the 7 elements that relate to a central idea. Actually, we offer you the same template with 3 or 5 horns as well. Enjoy another successful presentation and don’t be afraid to blow your own horn!
2. Hexagon Cycle Process
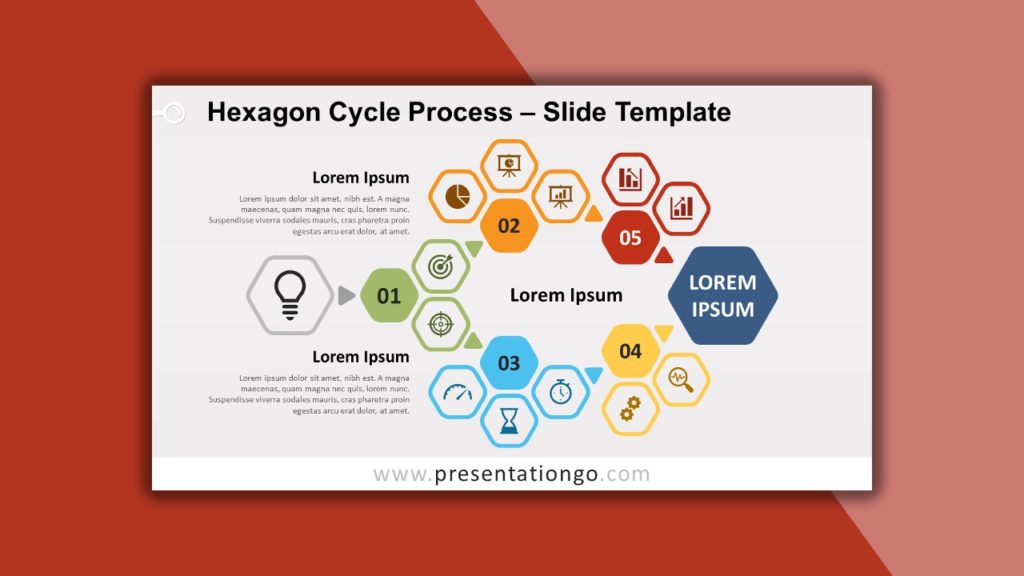
Sometimes our circular processes need a complex structure to be explained clearly. In this free Hexagon Cycle Process diagram, each one of your 5 steps is represented by 2 or 3 hexagons in which you can insert icons. It can also be used as a radial chart or even a linear process diagram with an entry door, an exit door, and 2 possible paths. However, you can adapt it into a classical circular flow by changing the direction of the arrows. This multipurpose template will definitely make you and your audience happy.
3. Bike and Cycle Wheel
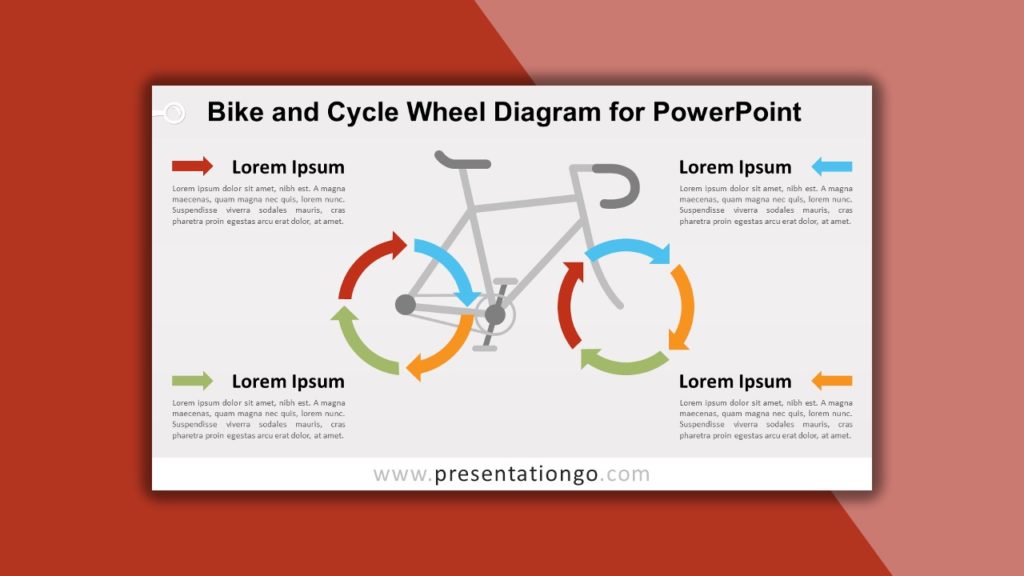
Are you seeking to describe a simple 4-stage cycle process but can’t find an original template? We have the perfect solution for you. This free Bike and Cycle Wheel represents a racing bicycle (aka road bike) with both its wheels made of 4 colorful arrows. This design makes it ideal to represent movement, continuity, endless cycles, tasks, and steps that keep repeating themselves. You can also describe each stage thanks to the text placeholders around the bike. Ready to take your audience on an amazing ride?
4. Fidget Spinner
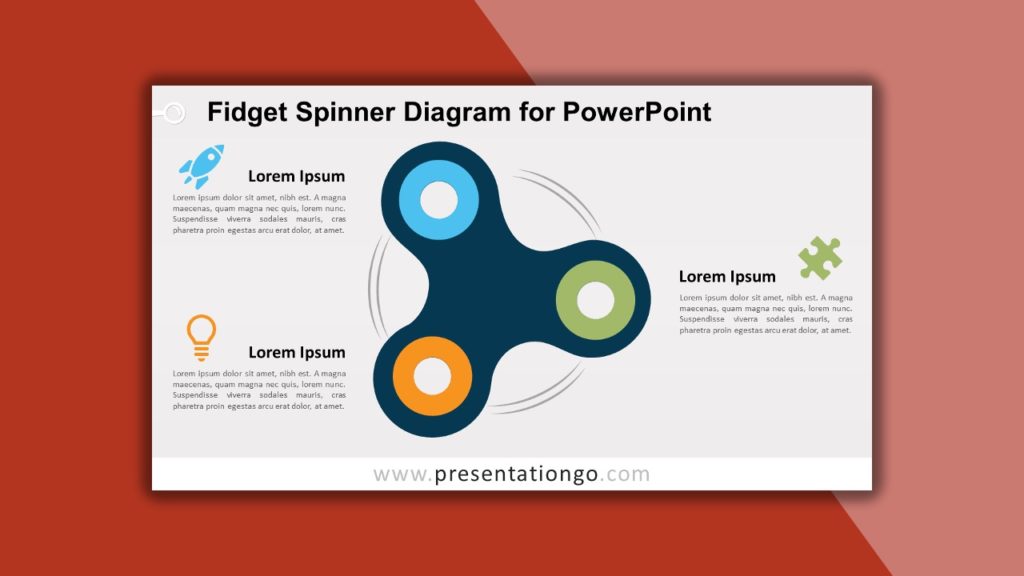
If you don’t want to take your audience on a bike ride, you should take them for a spin! This free fidget spinner diagram for PowerPoint is ideal to represent a continuing sequence of 3 stages, tasks, or events in a circular flow. The colorful three-lobed fidget spinner includes motion lines to illustrate movement and icons to represent your ideas or stages. Of course, you can also use it to show the relationship of 3 components to a whole or simply to illustrate 3 ideas or concepts.
5. Brain and Non-Directional Cycle
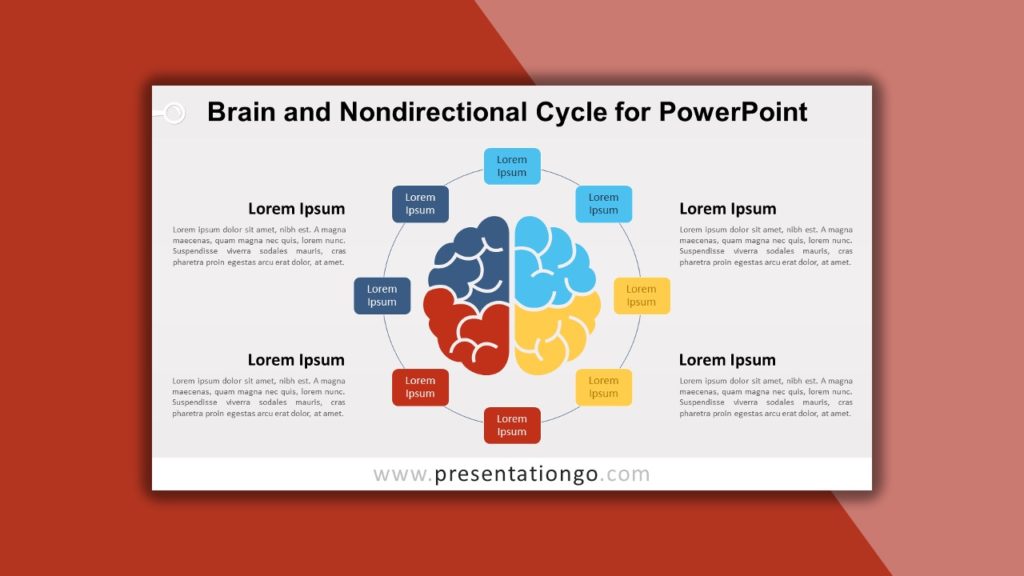
Which template should you choose to illustrate a circular sequence of stages, events, or even better, tasks or ideas? The answer is a no-brainer! This Brain Cycle offers a non-directional structure without arrows and a brain graphic in the center. The gray matter is not gray anymore but divided into 4 colored parts to represent 4 stages that can again be divided into two. This diagram represents indeed 8 stages but can be easily adapted to any number. Now you can show everyone you are the brains behind the project!
6. Rectangular Process
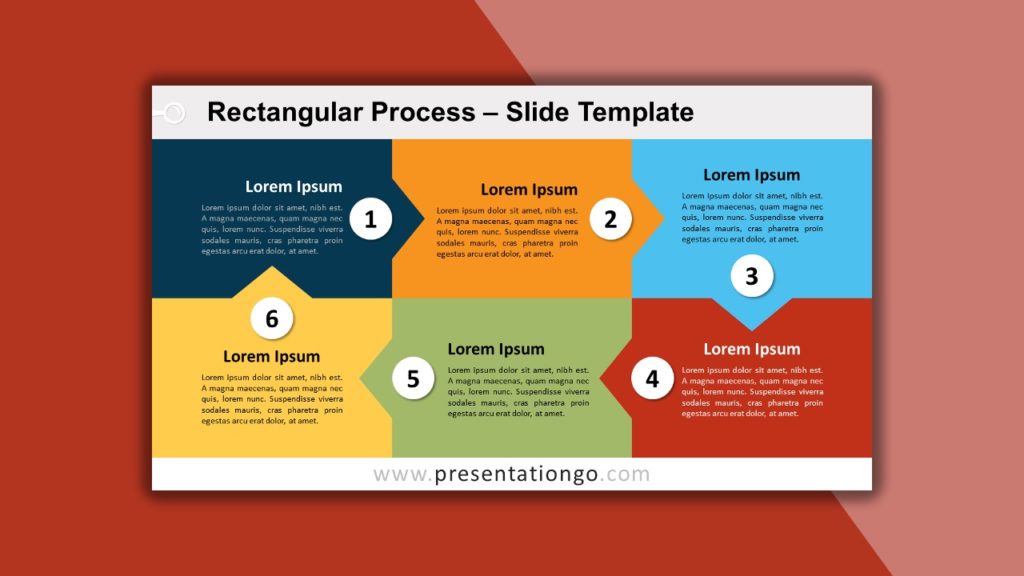
Who said circular processes have to be in the shape of a circle? This free original Rectangular Process template for PowerPoint and Google Slides proves us wrong. The design consists of 6 colorful blocks that include arrows and are thus interconnected. These chevron-like rectangles allow you to include an icon, a title, and a fairly big amount of text. You can now show your continuing sequence of 6 stages, tasks, or events in a rectangular flow!
7. From Process to Cycle
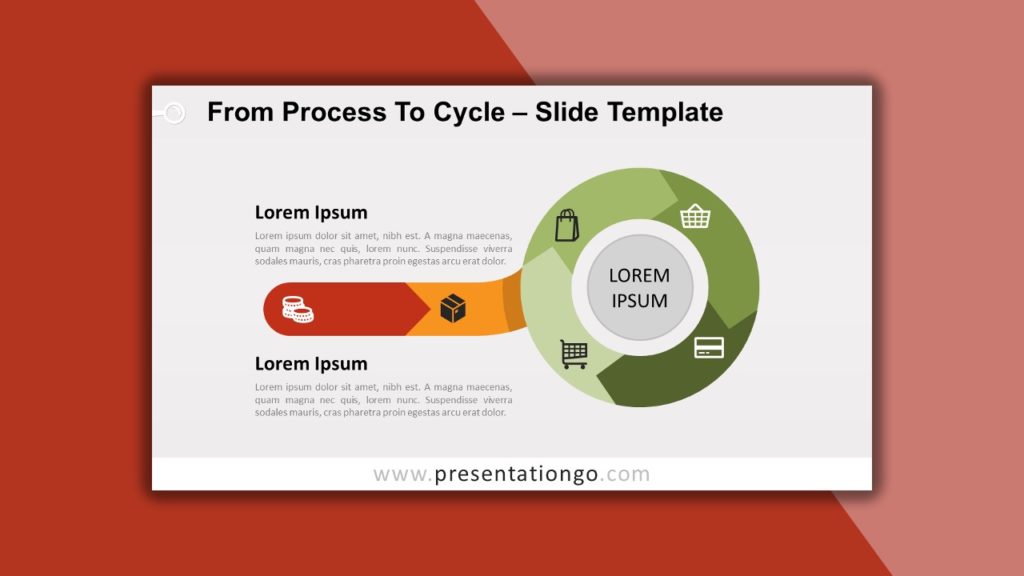
Does the sequence you want to depict start as a linear process and continue as a cycle? In this case, download this free From Process to Cycle template now! This combo diagram is an original option that starts with a 2-step horizontal process and ends with a 4-step cycle. The circular flow has a donut shape that allows you to include a title in the center. Besides, you can include icons inside the 4 colorful curved arrows.
8. Puzzle Cycle with 8 steps
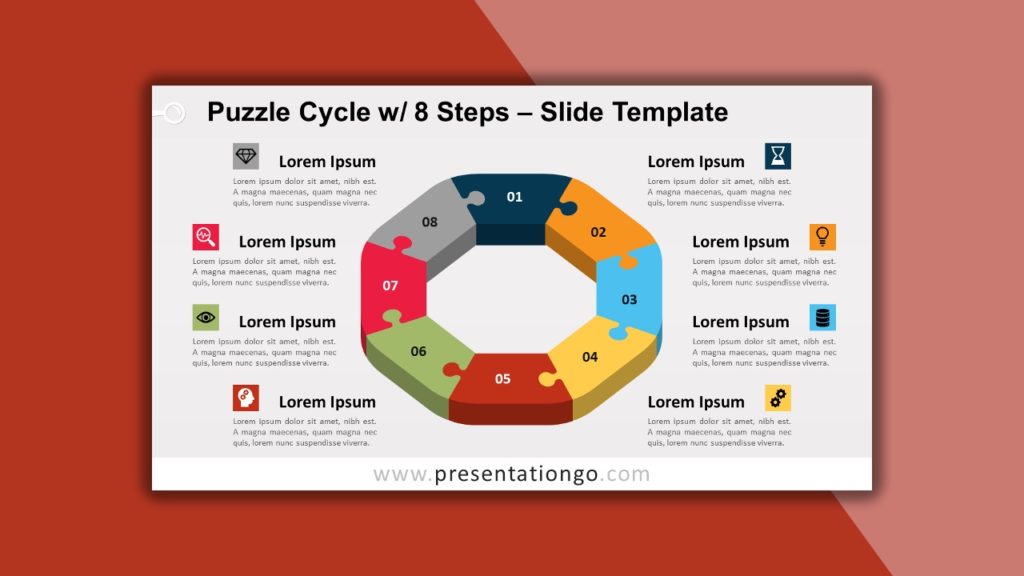
Are you puzzling over which template to use for your circular flow? Stop thinking and download this free Puzzle Cycle diagram for PowerPoint! It offers a 3D design of a donut-like octagonal shape with 8 puzzle pieces, assembled in a circular flow. Each piece displays a number and a different color to illustrate each one of the 8 steps, tasks, or events of your process. In addition, the editable graphics give you the possibility to insert titles, texts, and icons.
9. Serpentine Cycle
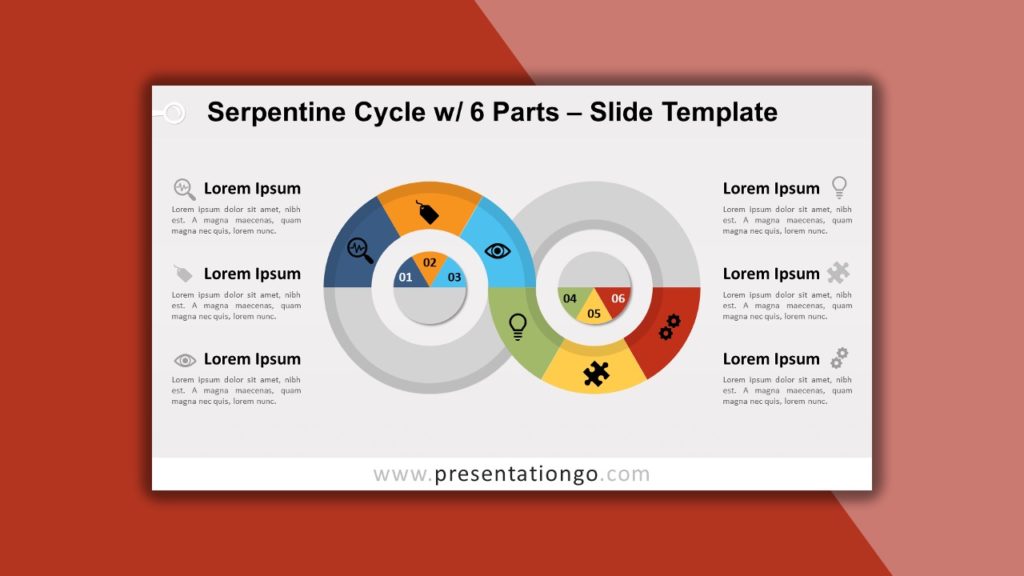
What if your cycle took the shape of a snake? This Free Serpentine Cycle with 6 parts for PowerPoint and Google Slides is also available with 4 or 8 parts. This modern design takes the form of an infinity loop diagram made of 2 donut charts horizontally aligned. Half of each donut has 3 equal colored slices. Besides, a circle in the center allows you to give a number to each step, task, or event. This original template will take your presentation to infinity and beyond!
10. Doodle Diverging Radial
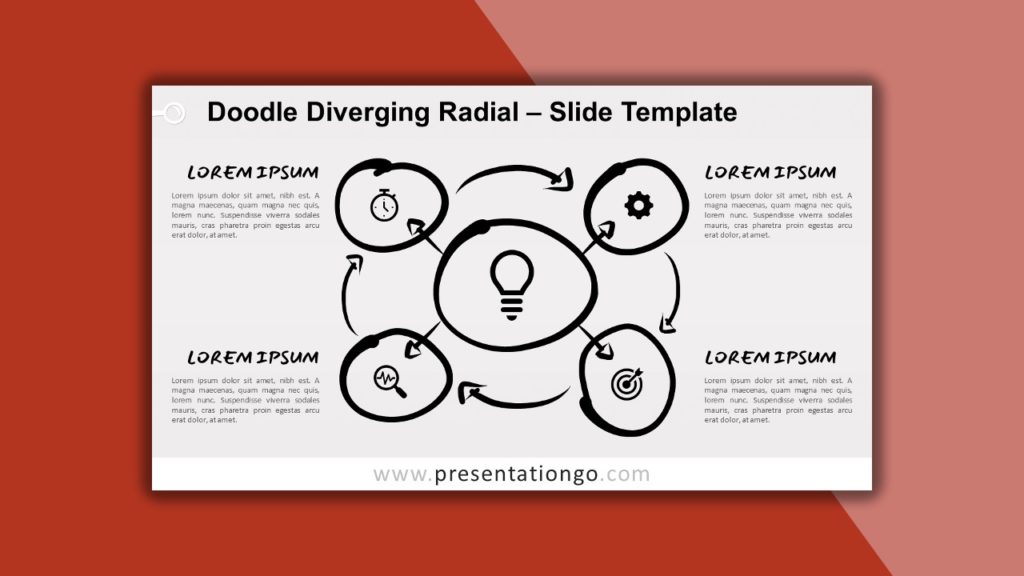
This free doodle Diverging Radial for PowerPoint and Google Slides will give a fresh and modern look to your presentation. Moreover, this slide is available in 3 different designs: white over black, black over white, or with hand-drawn circles filled with different colors. This radial diagram has four circle marker scribbles and arrows. Therefore, it can be used as a diverging radial chart around a central idea or for a cycle process. No doubt your presentation will draw everybody’s attention!
We hope you like our selection of the 10 Amazing Cycle Process Diagrams Templates for Presentations.
