Skip to content
PresentationGO
  • Explore
    • Templates
      • Abstract
      • Sports
      • Business
      • Religion & Holidays
      • Nature
      • Technology
      • Professions
      • Flat Lays & Scenes
      • Health & Recreation
      • Color Palettes
      • Education
      • Food & Drink
      • Science
      • CertificatesNEW
      • All Templates
    • Charts & Diagrams
      • Processes
        • Circular
        • Linear
        • Alternating
        • Stairs
        • Bending
      • Funnels
      • Pyramids
      • Matrix Charts
      • Business Models
      • Non-Data-Driven Chart Alternatives
      • Radial Diagrams
      • Flow Charts
      • Data-Driven Charts & Graphs
      • Organizational Charts
      • Clusters & Relationships
      • Venn Diagrams
      • All Charts & Diagrams
    • Text & Tables
      • Text Boxes
      • Comparisons
      • Paper & Banners
      • Numbered Lists
      • Speaking Bubbles
      • Pricing Tables
      • Bullet Point / Text Layouts
      • Contents & Table of Contents
      • Quotes
      • Word Clouds
      • To-do & Checklists
      • All Text & Tables
    • Timelines & Planning
      • Calendars
      • Timelines
      • Gantt Charts
      • Agenda
      • All Timelines & Planning
    • Graphics & Metaphors
      • Concepts
      • Silhouettes & People
      • Light Bulbs
      • Trees
      • Letters & Numbers
      • Signs
      • Mockups
      • Food
      • Money
      • Road
      • Target and Goals
      • All Graphics & Metaphors
    • Maps & Flags
      • Flag Templates
      • Continent Maps
      • Country Maps
        • Africa
        • Asia
        • Australia / Oceania
        • Europe
        • North America
        • South America
      • World Maps
      • All Maps
    • AI ImagesNEW
  • Search by
    • Colors
      • Black
      • Blue
      • Brown
      • Gray
      • Green
      • Cream
      • Light Blue
      • Orange
      • Pink
      • Purple
      • Gold
      • Red
      • White
      • Yellow
      • Teal
    • Steps (Options)
      • 2 options
      • 3 options
      • 4 options
      • 5 options
      • 6 options
      • 7 options
      • 8 options
      • 9 options
      • 10 options
      • 12 options
  • Templates
  • Charts & Diagrams
  • Text & Tables
  • Timelines & Planning
  • Graphics & Metaphors
  • Maps & Flags
  • AI ImagesNEW

Charts & Diagrams

Transform complex data into clear visuals with our extensive collection of 1,707 Charts & Diagrams templates for PowerPoint and Google Slides. Choose from flowcharts, mind maps, data-driven graphs, organizational charts, and more to engage your audience and enhance your presentations.

Main Charts & Diagrams Categories:ProcessesShapesRadial DiagramsMatrix ChartsGeometric ShapesNon-Data-Driven Chart AlternativesBusiness ModelsData-Driven Charts & GraphsFlow ChartsOrganizational ChartsStagesVenn DiagramsMulti-Level ChartsClusters & RelationshipsTrees
Free PowerPoint and Google Slides 7-Step Arc Connector Cycle template with bright circular layout, colored arcs, icons, and text placeholders.
Charts & Diagrams
7 options

7-Step Arc Connector Cycle

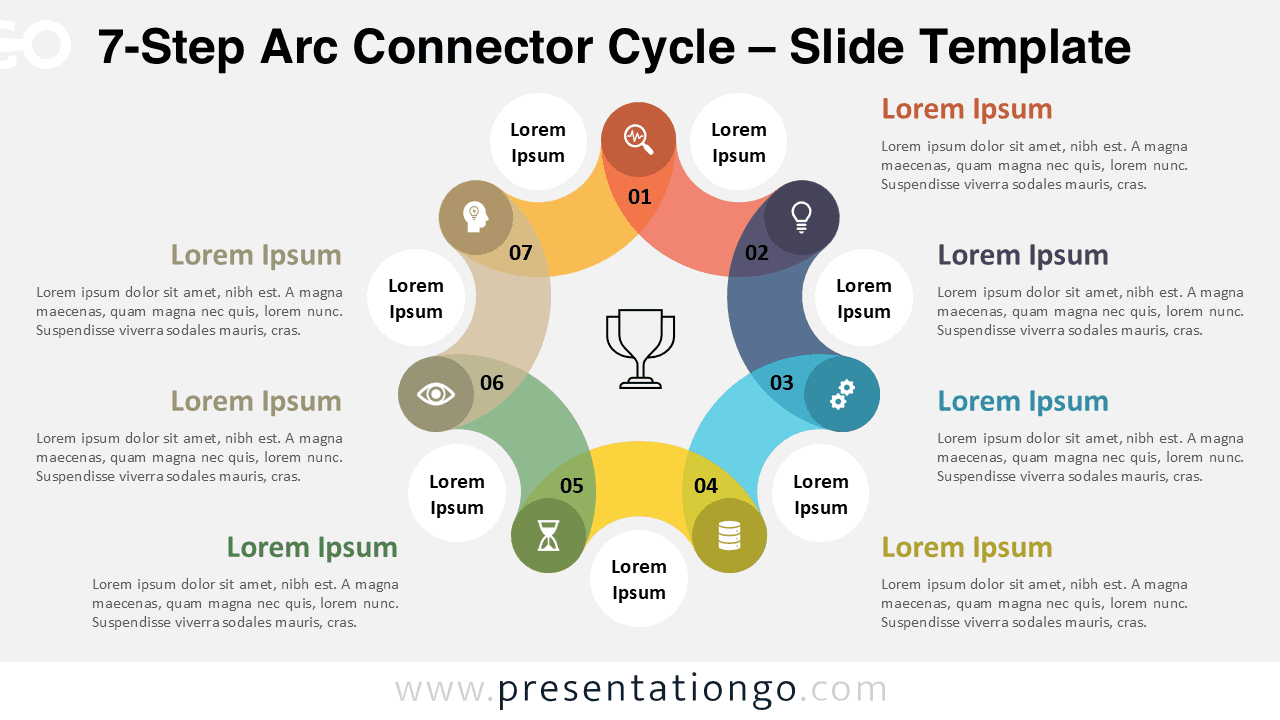
Download the 7-Step Arc Connector Cycle template to represent business or project stages in PowerPoint and Google Slides.

Google Slides, PPTX

4:316:9

Light-themed version of a 6-step circular process diagram featuring vibrant arcs, editable icons, and text areas for modern PowerPoint or Google Slides presentations.
Charts & Diagrams
6 options

6-Step Arc Connector Cycle

Download this free 6-Step Arc Connector Cycle PowerPoint and Google Slides template for visualizing circular workflows and processes.

Google Slides, PPTX

4:316:9

Free 5-Step Arc Connector Cycle PowerPoint template and Google Slides design with a white background, five bright arcs in circular flow, and editable icon placeholders.
Charts & Diagrams
5 options

5-Step Arc Connector Cycle

Visualize your workflow with this free 5-Step Arc Connector Cycle template for PowerPoint and Google Slides.

Google Slides, PPTX

4:316:9

Free Interwoven Loop Quartet PowerPoint template and Google Slides presentation diagram featuring four loops with icons on a light background.
Charts & Diagrams
4 options

Interwoven Loop Quartet

A dynamic ribbon-style diagram to showcase four key components that converge toward a central outcome.

Google Slides, PPTX

4:316:9

Free 6-Option Speedometer Gauge PowerPoint template and Google Slides diagram featuring a widescreen layout with four gauges on a light background.
Charts & Diagrams
6 options

6-Option Speedometer Gauge Diagram

Compare multiple KPIs at a glance with this 6-level speedometer gauge diagram designed for clear dashboards and performance reporting.

Google Slides, PPTX

4:316:9

Free 5-Option Speedometer Gauge PowerPoint template and Google Slides diagram featuring a widescreen layout with four gauges on a light background.
Charts & Diagrams
5 options

5-Option Speedometer Gauge Diagram

A dashboard-style diagram with five categories to present KPIs and evaluation results across multiple performance areas.

Google Slides, PPTX

4:316:9

Free 4-Option Speedometer Gauge PowerPoint template and Google Slides diagram featuring a widescreen layout with four gauges on a light background.
Charts & Diagrams
4 options

4-Option Speedometer Gauge Diagram

Compare four performance indicators in one dashboard with this 4-option gauge diagram template, fully editable for PowerPoint and Google Slides.

Google Slides, PPTX

4:316:9

Free 3-Option Speedometer Gauge PowerPoint template and Google Slides diagram featuring a widescreen layout with four gauges on a light background.
Charts & Diagrams
3 options

3-Option Speedometer Gauge Diagram

Showcase and compare four KPIs with this three-level gauge diagram designed for dashboard-style presentations.

Google Slides, PPTX

4:316:9

Free Ten-Part Petal Cycle Diagram PowerPoint template and Google Slides presentation diagram showing Ten petals in a circular cycle on light background.
Charts & Diagrams
10 options

Ten-Part Petal Cycle Diagram

Use this petal-style cycle diagram to highlight ten stages, ideas, or principles in an integrated circular flow.

Google Slides, PPTX

4:316:9

Free Nine-Part Petal Cycle Diagram PowerPoint template and Google Slides presentation diagram showing Nine petals in a circular cycle on light background.
Charts & Diagrams
9 options

Nine-Part Petal Cycle Diagram

Use this diagram to display nine steps, features, or concepts in a clean circular cycle with customizable slides.

Google Slides, PPTX

4:316:9

Free Eight-Part Petal Cycle Diagram PowerPoint template and Google Slides presentation diagram showing Eight petals in a circular cycle on light background.
Charts & Diagrams
8 options

Eight-Part Petal Cycle Diagram

Use this eight-part petal cycle diagram to present complete frameworks, workflows, or balanced models with clear step-by-step design.

Google Slides, PPTX

4:316:9

Free Seven-Part Petal Cycle Diagram PowerPoint template and Google Slides presentation diagram showing seven petals in a circular cycle on light background.
Charts & Diagrams
7 options

Seven-Part Petal Cycle Diagram

This template presents seven petals in a flowing cycle, ideal for explaining multi-step processes and strategies in PowerPoint and Google Slides.

Google Slides, PPTX

4:316:9

Older posts
Newer posts
← Previous Page1 … Page12 Page13 Page14 … Page143 Next →
Search Templates by categories
Templates Charts & Diagrams Text & Tables Maps & Flags Timelines & Planning Graphics & Metaphors
Search Templates by colors
Support us
icon of a coffee cup for 'support us' - PresentationGo
... buying us a coffee

Love our templates? Show your support with a coffee!

Donate Here

Thank you for fueling our creativity!

Logotype PresentationGo
Content

Templates

Charts & Diagrams

Text & Tables

Graphics & Metaphors

Timelines & Planning

Maps

AI ImagesNEW

Best-Ofs & Tips

Legal

Terms and Conditions

Privacy Statement

Cookie Policy

Digital Millennium Copyright Act (DMCA) Policy

Disclaimer

Help

Contact us

FAQ

Templates

Charts & Diagrams

Text & Tables

Graphics & Metaphors

Timelines & Planning

Maps

Best-Ofs & Tips

Terms and Conditions

Privacy Statement

Cookie Policy

Digital Millennium Copyright Act (DMCA) Policy

Disclaimer

Contact us

FAQ

© Copyright 2026 Ofeex | PRESENTATIONGO® is a registered trademark | All rights reserved.

PresentationGO
Cookies & Privacy

To provide the best experiences, we and our partners use technologies like cookies to store and/or access device information. Consenting to these technologies will allow us and our partners to process personal data such as browsing behavior or unique IDs on this site and show (non-) personalized ads. Not consenting or withdrawing consent, may adversely affect certain features and functions.

Click below to consent to the above or make granular choices. Your choices will be applied to this site only. You can change your settings at any time, including withdrawing your consent, by using the toggles on the Cookie Policy, or by clicking on the manage consent button at the bottom of the screen.

Functional Always active
Needed for the website to work properly.
Preferences
Remember your settings (like language or display choices).
Statistics
The technical storage or access that is used exclusively for statistical purposes. Help us understand how the site is used so we can improve it (Google Analytics).
Marketing
Used to show relevant ads and measure ad performance (Google AdSense and partners).
Statistics

Marketing

Features
Always active

Always active
  • Manage options
  • Manage services
  • Manage {vendor_count} vendors
  • Read more about these purposes
Manage preferences
  • {title}
  • {title}
  • {title}
PresentationGO
Cookies & Privacy

We use cookies to run the site, measure traffic, and show ads that help keep our downloads free. Manage your choices anytime.

Functional Always active
Needed for the website to work properly.
Preferences
Remember your settings (like language or display choices).
Statistics
The technical storage or access that is used exclusively for statistical purposes. Help us understand how the site is used so we can improve it (Google Analytics).
Marketing
Used to show relevant ads and measure ad performance (Google AdSense and partners).
Statistics

Marketing

Features
Always active

Always active
  • Manage options
  • Manage services
  • Manage {vendor_count} vendors
  • Read more about these purposes
Manage preferences
  • {title}
  • {title}
  • {title}

Thank you for downloading from PresentationGO!

AI Images are free to use with no attribution required (though appreciated).

Presentation templates are also free, but require attribution.
For example, you can include this credit somewhere visible:

If you enjoy our free resources and want to support us, you can:

Buy us a coffee

Thank you for your continued support!