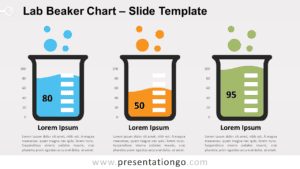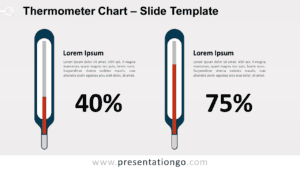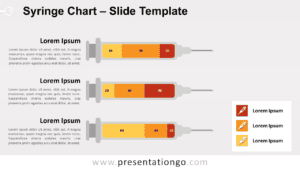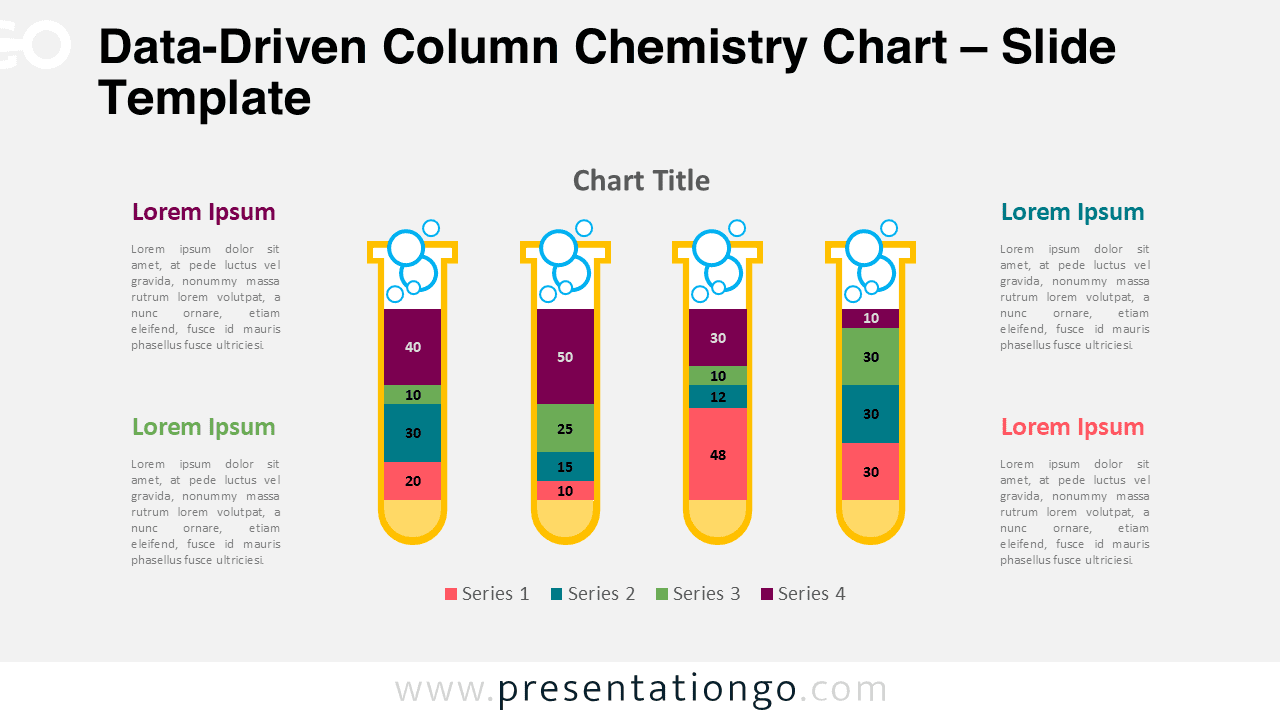
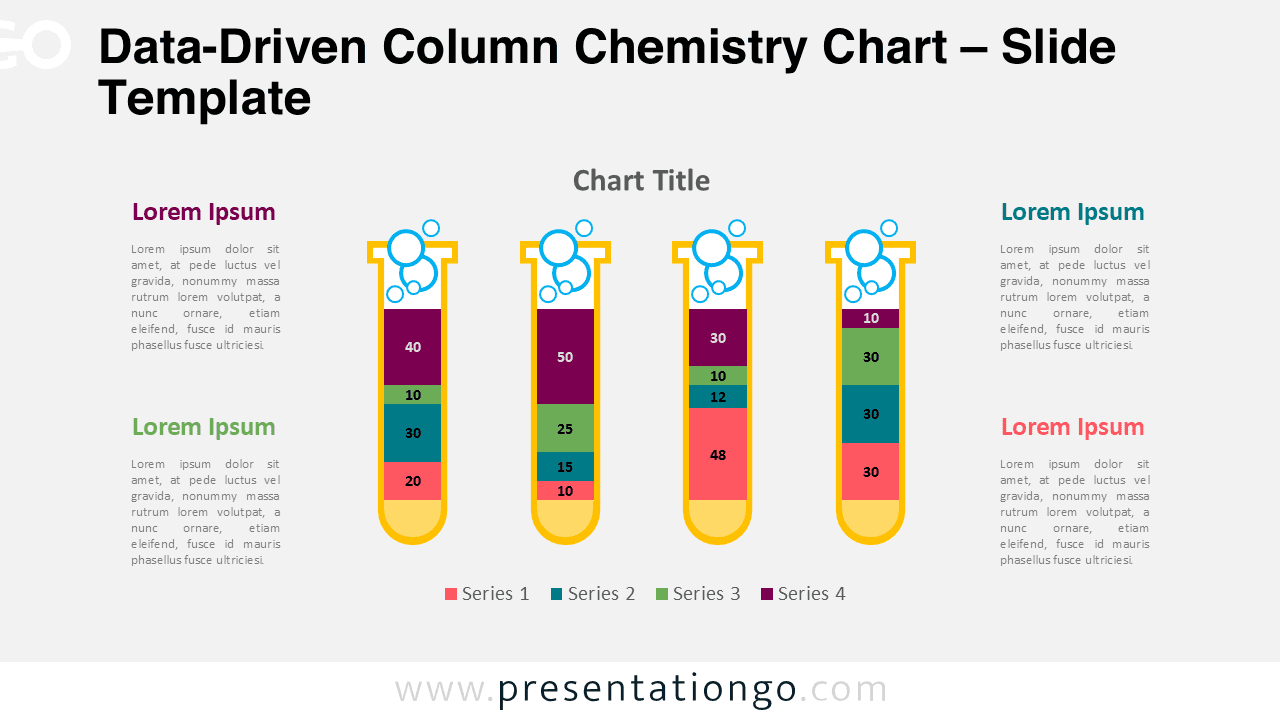
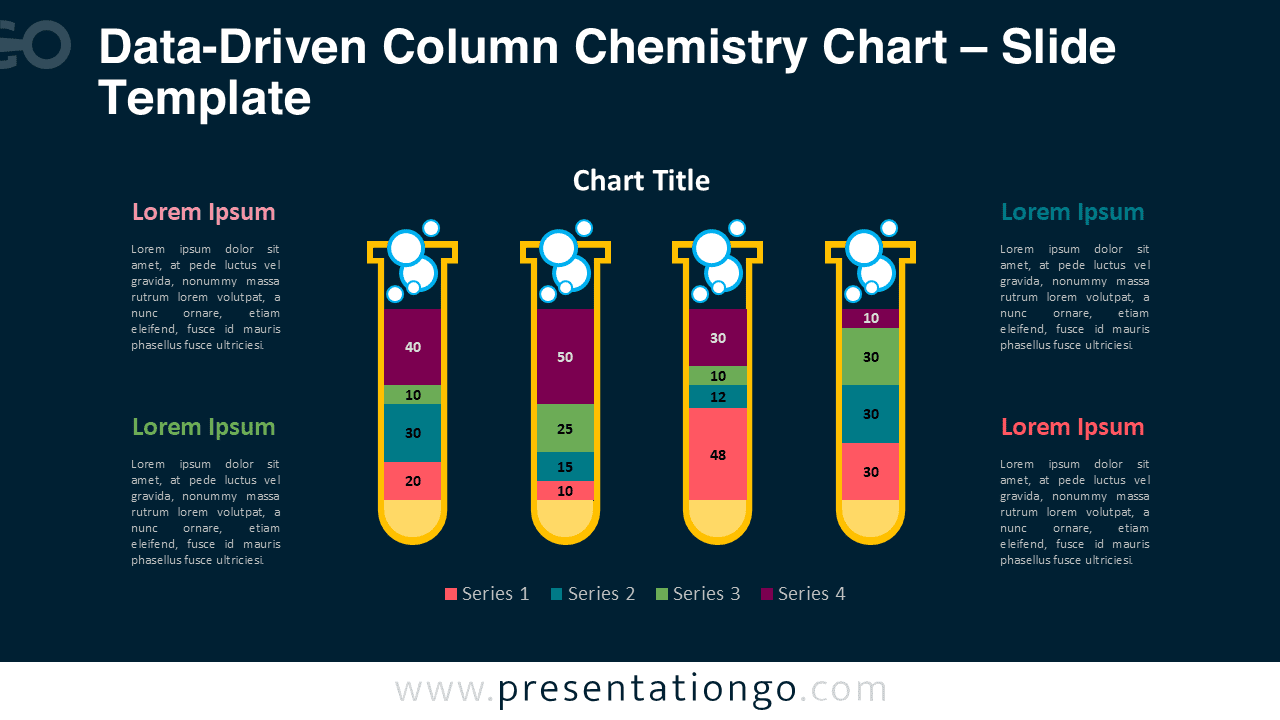
Free Chemistry Column PowerPoint Chart with test tubes. PowerPoint diagram using editable graphics with built-in data driven column chart.
Chemistry Column Chart
In this example we use a 100% stacked column chart, but you can easily change it if needed to suit your purpose.
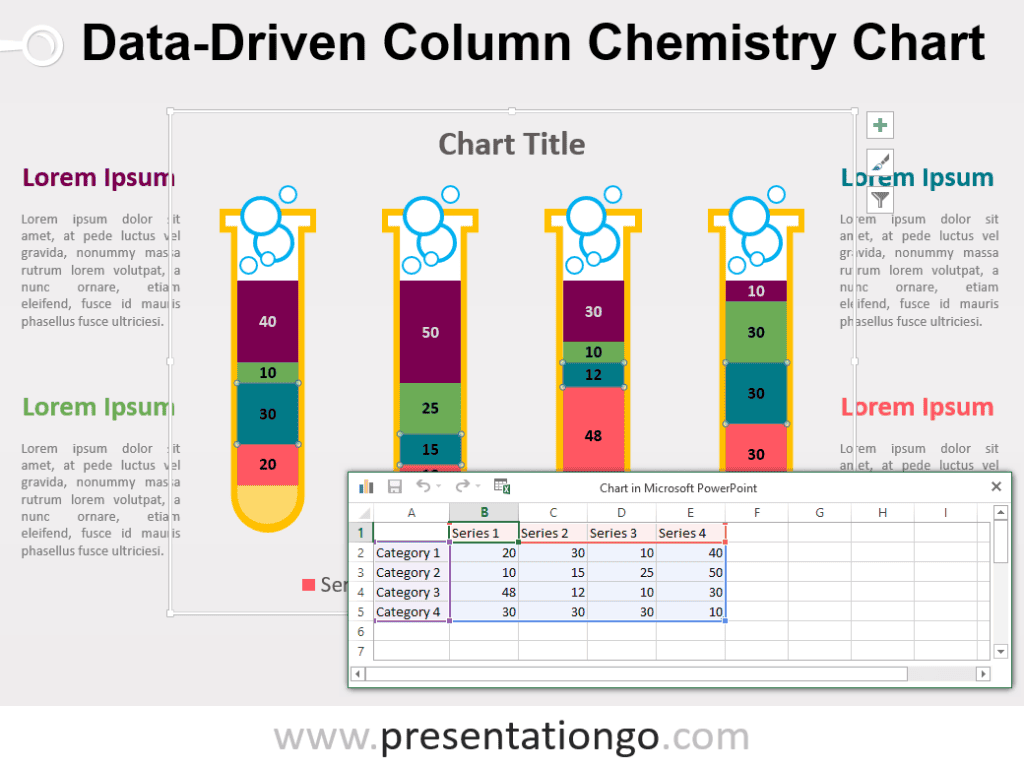
And because it is a built-in data driven PowerPoint chart, you can easily change data series and format:
Template Preview


Change the data series:
You can change the data series in two different ways:
- Use chart filters to show or hide data in your chart.
- Use the Select Data Source dialog box to edit the data in your series or rearrange them on your chart.
Chart filters
- Click anywhere in your chart.
- Click the Chart Filters button Chart Filters button next to the chart.
- On the Values tab, check or uncheck the series or categories you want to show or hide.
Values tab in the Chart Filters gallery - Click Apply.
- If you want to edit or rearrange the data in your series, click Select Data, and then follow steps 2-4 in the next section.
Select Data Source dialog box
- Right-click your chart, and then choose Select Data.
You can also get to this dialog box from the Value tab in the Chart Filters gallery.
- In the Legend Entries (Series) box, click the series you want to change.
- Click Edit, make your changes, and click OK.
To rearrange a series, select it, and then click Move Up button or Move Down button.
Change the chart type:
You can also replace the 100% stacked column by a cluster or a simple ‘stacked column chart‘:
- Right click the chart
- Select Change Chart Type…
This ‘Chemistry Column PowerPoint Chart’ template features:
- 2 unique slides
- Light and Dark layout
- Ready to use template with text placeholders
- Completely editable shapes
- Standard (4:3) and Widescreen (16:9) aspect ratios
- PPTX file (PowerPoint)
Free font used:
- Calibri (System Font)