Free syringe chart for PowerPoint and Google Slides. Illustration of three (3) syringes with a needle and data-driven bar chart. Flat design style. Editable graphics with text placeholders.
Syringe Chart
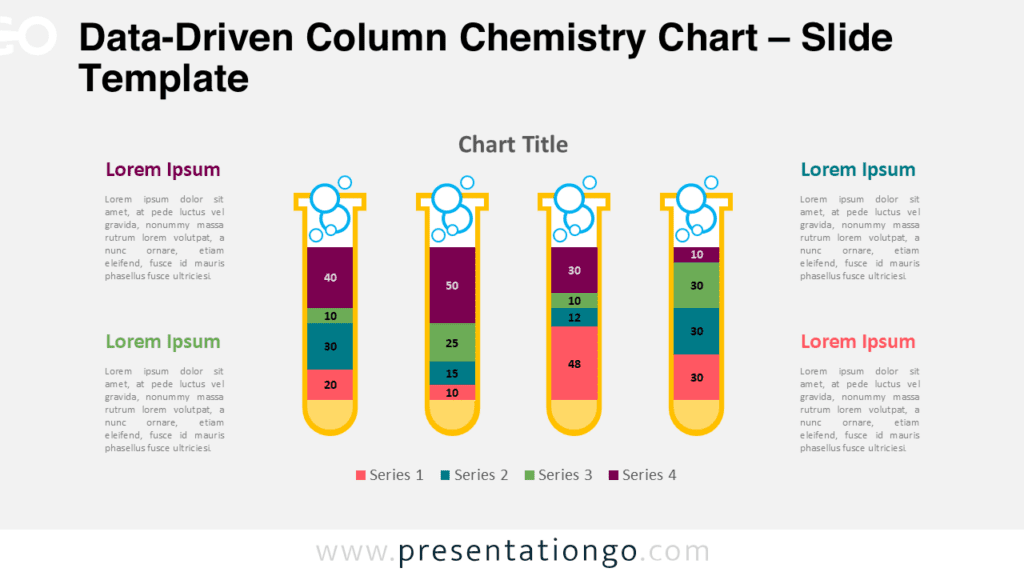
Use this infographic chart in your presentation to compare quantitative results. These syringe charts will be perfect for any topics related to medicine, healthcare, hospital, drugs, vaccine, or pharmacy.
Shapes are 100% editable: colors and sizes can be easily changed.
Usage instructions:
The PowerPoint (PPTX) version:
Built-in data driven PowerPoint chart: made with stacked bar chart, you can easily change data series and format (e.g., colors).
Just right-click the chart to edit the data series (Edit Data):
The Google Slides version:
Includes 2 slide option designs: Standard (4:3) and Widescreen (16:9).
Widescreen (16:9) size preview:


This ‘Syringe Chart for PowerPoint’ features:
- 2 unique slides
- Light and Dark layout
- Ready to use template with text placeholders
- Completely editable shapes
- Data-driven (100% stacked bar) charts
- Standard (4:3) and Widescreen (16:9) aspect ratios
- PPTX file
Free fonts used:
- Helvetica (System Font)
- Calibri (System Font)