Free demographic infographic chart for PowerPoint. 1-slide snapshot template to visualize your demographic data. Editable graphics and data-driven charts.
Demographic Snapshot
If you are a Market Research consultant or analyst, you probably asked yourself at least once that question: “How can I describe and summarize my sample (population) in one visually-appealing slide?”
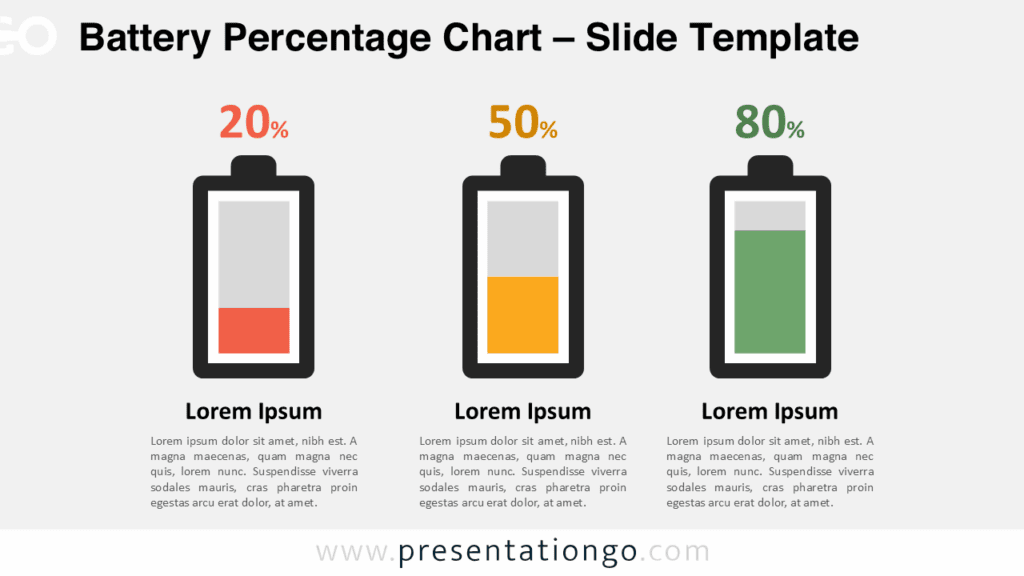
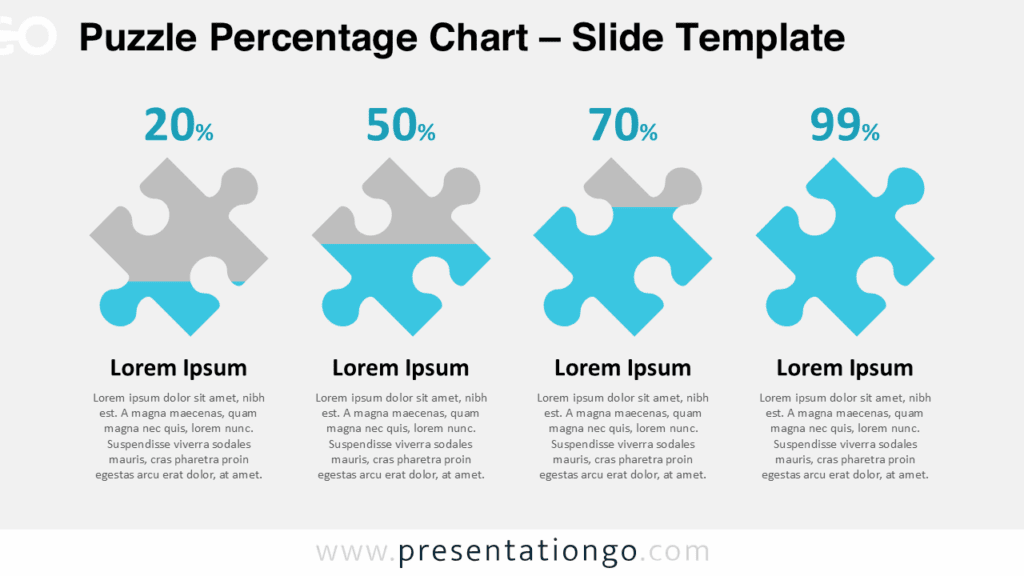
PresentationGO made it easy for you! This template slide combines different data-driven charts – like doughnut pie charts, bar charts, to make your demographic data nicely presented.
2 comments concerning the bar charts: first of all, they are preferred to column charts because they tend to organize the slide space better. Second of all, the labels are editable text boxes that are unlinked to the data/chart so that you can have a better control over the length/height of the text box. Also, that “trick” allows every bar chart to have the exact same scale.
Shapes are 100% editable: colors and sizes can be easily changed.
Includes 2 slide option designs: Standard (4:3) and Widescreen (16:9).
Widescreen (16:9) size preview:


This ‘Demographic Snapshot – Charts for PowerPoint’ features:
- 2 unique slides
- Light and Dark layout
- Ready to use template with text placeholders
- Completely editable shapes
- Data-driven charts
- Standard (4:3) and Widescreen (16:9) aspect ratios
- PPTX file
Free fonts used:
- Helvetica (System Font)
- Calibri (System Font)


Comments are closed.