Free pyramid population template for PowerPoint. Data-driven bar chart to show the distribution of various age groups in a population. Editable graphics.
Pyramid Population Template
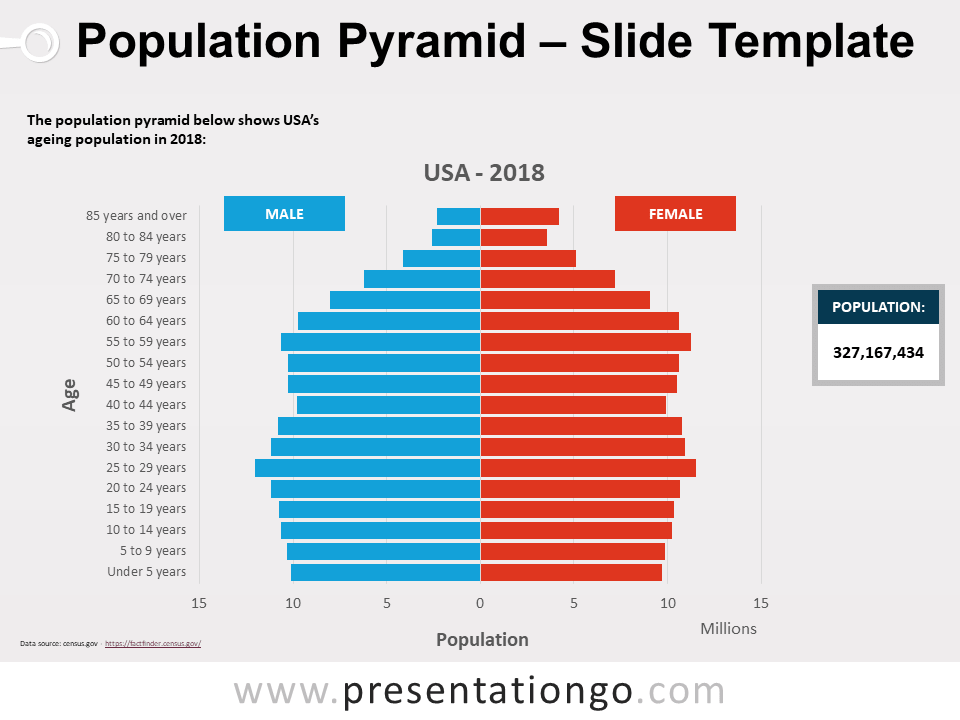
The pyramid population, also known as the age-sex pyramid, is a chart where two sets of data series (male and female) are displayed side by side. This graphical illustration makes the distribution of the 2 age groups very easy to compare.
This type of chart is also called the butterfly chart.
It is made with PowerPoint data-driven bar chart: you can easily edit and change data series and format.
This template features the United States age structure in 2018 (real data from Census).
Shapes are 100% editable: colors and sizes can be easily changed.
Includes 2 slide option designs: Standard (4:3) and Widescreen (16:9).
Widescreen (16:9) size preview:
This ‘Pyramid Population Template for PowerPoint’ features:
- 2 unique slides: size and % population
- Example with the United States of America (USA) for the year 2018 (real data)
- Ready to use template
- Data-driven bar chart (data can be edited in PowerPoint)
- Standard (4:3) and Widescreen (16:9) aspect ratios
- PPTX file
Free fonts used:
- Helvetica (System Font)
- Calibri (System Font)


Comments are closed.