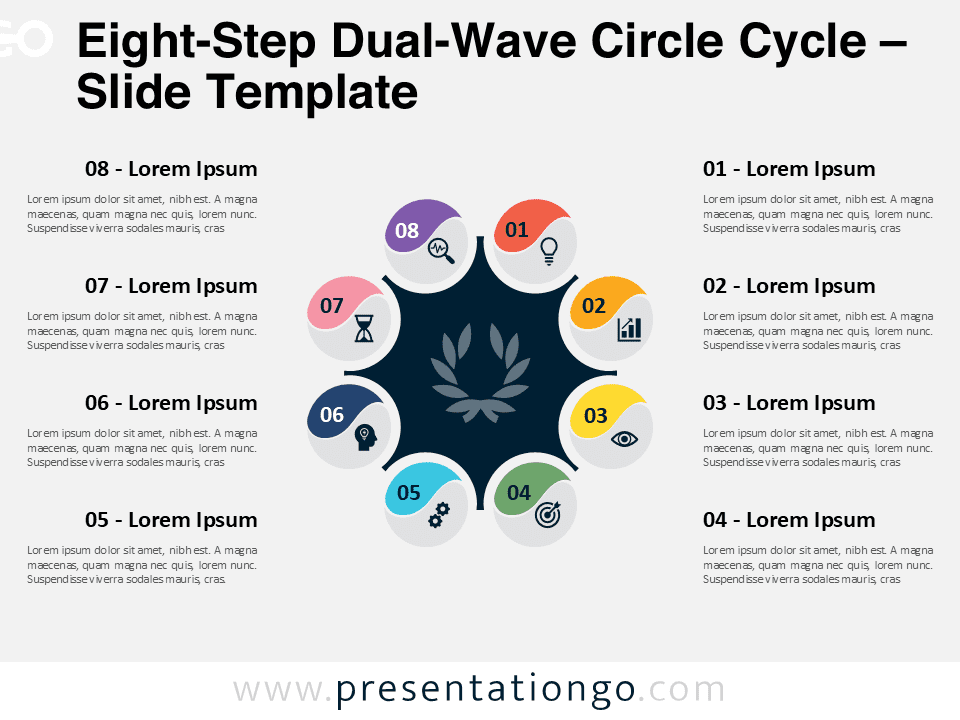
Free infographic radial for PowerPoint and Google Slides. Cycle radial diagram with 4 or 8 surrounding circles and rounded rectangle shapes. Editable graphics with icons and text placeholders.
Infographic Radial
Radial diagrams show elements in relation to a core element. Most of the time, these elements explain the central concept or idea.
It’s also worth noting that the elements can be independent or related somehow to each other. Indeed, it’s possible to relate the surrounding elements to emphasize a circular flow around the central idea.
In fact, this infographic radial combines both types of relationships. Indeed, the 4 or 8 elements are connected one to another. And they also relate to the core concept.
Therefore, you can use this radial diagram to explain how the outer elements contribute to the central idea. Also, it will perfectly represent a continuing sequence of 4 or 8 stages, tasks, or events in a circular flow.
Shapes are 100% editable: colors and sizes can be easily changed.
Includes 2 slide option designs: Standard (4:3) and Widescreen (16:9).
Widescreen (16:9) size preview:
This ‘Infographic Radial for PowerPoint and Google Slides ‘ features:
- 2 unique slides
- Light and Dark layout
- Ready to use template with icons and text placeholders
- Completely editable shapes
- Uses a selection of editable PowerPoint icons
- Standard (4:3) and Widescreen (16:9) aspect ratios
- PPTX file and for Google Slides
Free fonts used:
- Helvetica (System Font)
- Calibri (System Font)


