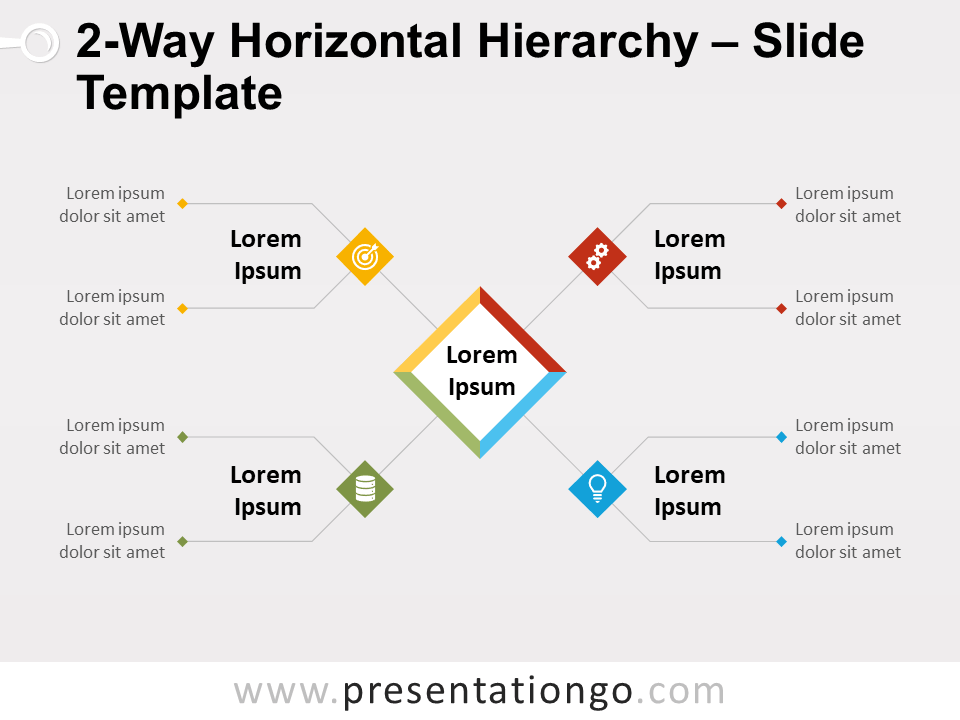
Free matrix circle relationship for PowerPoint and Google Slides. Four circle elements with associated information related to a central main idea. Great as a matrix and a radial, or to display hierarchical data. Editable graphics with icons and text placeholders.
Matrix Circle Relationship
This new diagram is definitely a ‘must-have’ in your presentation toolbox! As a matter of fact, the ways you could use it are pretty much endless.
Let’s describe this matrix circle relationship diagram. The main circle shape, in the middle, connects to 4 other secondary circles. And each of these circles also relates to other elements (more specifically three).
First, just like a matrix, you can show the relationships of four elements to a whole. Let’s think of a common example, the SWOT analysis diagram. Each of the 1st-level elements can illustrate the four parameters: strengths, weaknesses, opportunities, and threats. Then the sub-levels help you better visually describe the 4 factors. For example, the circles are perfect shapes to embed icons of your choice.
In addition, this multipurpose diagram is also a radial diagram. Indeed, it shows the relationship of 4 elements of information to a central idea.
Finally, this illustration can also be considered as a hyperbolic tree. This kind of diagram is useful to display a tree of hierarchical data or information.
Shapes are 100% editable: colors and sizes can be easily changed.
Includes 2 slide option designs: Standard (4:3) and Widescreen (16:9).
Widescreen (16:9) size preview:
This ‘Matrix Circle Relationship for PowerPoint and Google Slides’ features:
- 2 unique slides
- Light and Dark layout
- Ready to use template with icons and text placeholders
- Completely editable shapes
- Uses a selection of editable PowerPoint icons
- Standard (4:3) and Widescreen (16:9) aspect ratios
- PPTX file and for Google Slides
Free fonts used:
- Helvetica (System Font)
- Calibri (System Font)


Comments are closed.