Free racing cars bar chart for PowerPoint and Google Slides. Infographic bar chart with horizontal contrails. Non-data-driven bar chart alternative for presentations. Editable graphics with text placeholders.
Racing Cars Bar Chart
We had so much fun designing this collection of 3 template slides featuring racing cars!
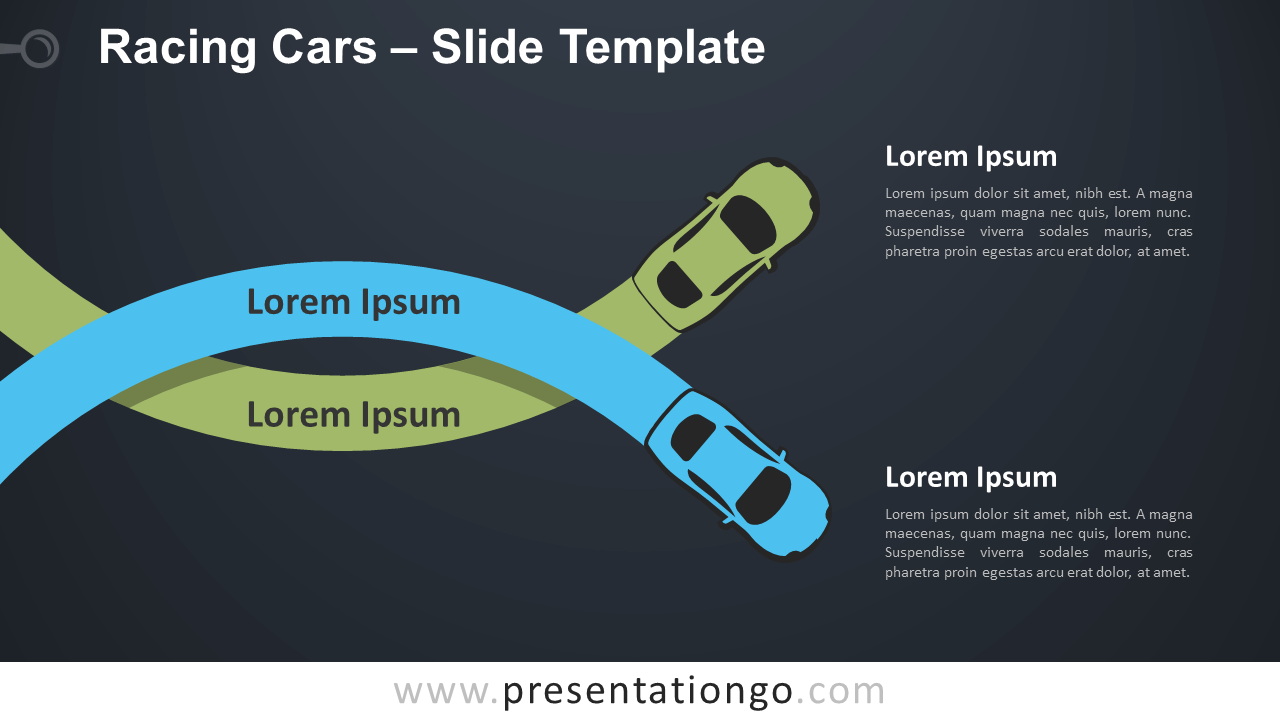
It is usually more common to have roads to represent different types of lines (most often processes). Therefore, these infographics with a singular path behind cars will make your slides distinctive.
Just like airplane contrails, these infographics showcase sports cars leaving a singular path behind them.
More specifically, this chart illustrates colorful cars with horizontal paths behind them. This is a non-data-driven chart, meaning that you can adjust manually the width of the bars.
You can insert your own text labels, slide the bars (tails) horizontally, and customize the numbers accordingly.
Use this template to showcase quantitative results, to illustrate and compare percentages for example.
Usage instructions:
Slide the horizontal rectangle shape left/right and adjust the number accordingly.
Shapes are 100% editable: colors and sizes can be easily changed.
Includes 2 slide option designs: Standard (4:3) and Widescreen (16:9).
Widescreen (16:9) size preview:


This ‘Racing Cars Bar Chart for PowerPoint and Google Slides’ features:
- 2 unique slides
- Light and Dark layout
- Ready to use template with text placeholders
- Completely editable shapes
- Standard (4:3) and Widescreen (16:9) aspect ratios
- PPTX file and for Google Slides
Free fonts used:
- Helvetica (System Font)
- Calibri (System Font)
The complete Racing Cars template collection:


Comments are closed.