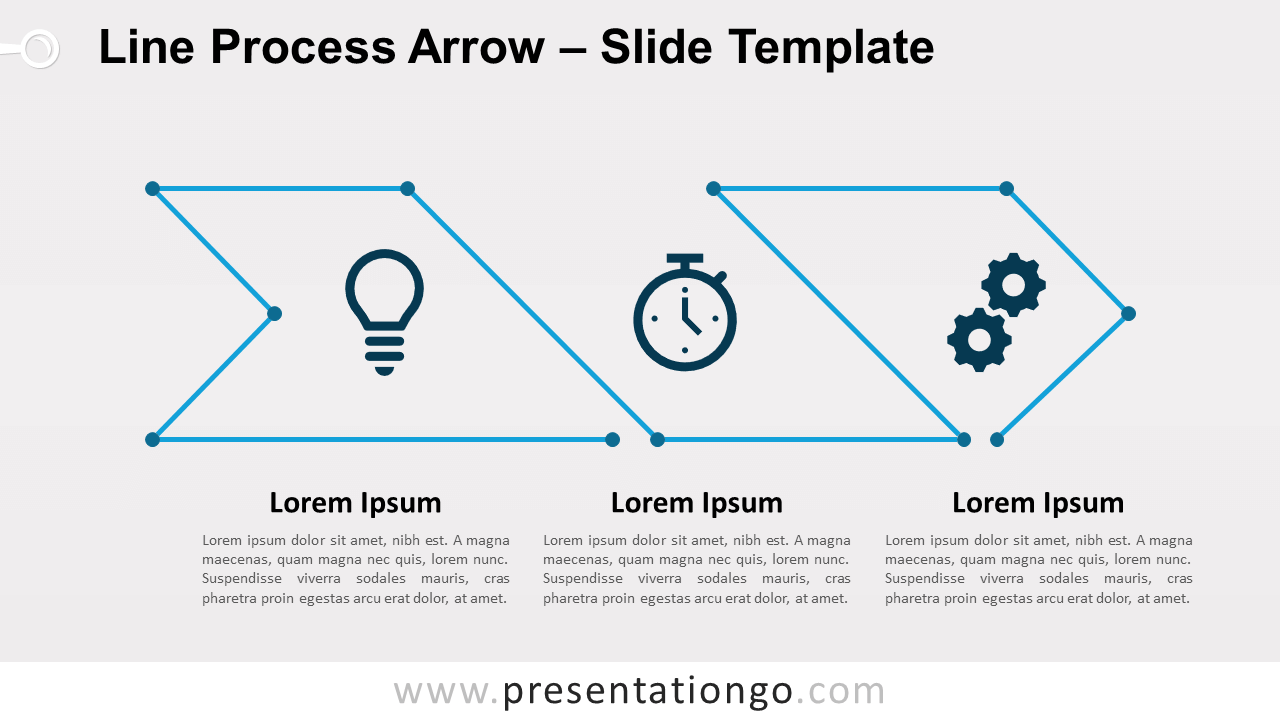
Line Process Arrow for PowerPoint and Google Slides
A 3-step continuous arrow process diagram designed with line connectors.
Google SlidesPPTX
4:3,16:9
These charts and diagrams for Google Slides and PowerPoint are ideal to show conversions from one step to the next. They indeed illustrate the transformations in your process, task, or workflow.
These charts and diagrams for Google Slides and PowerPoint are ideal to show conversions from one step to the next. They indeed illustrate the transformations in your process, task, or workflow.
Google SlidesPPTX
4:3,16:9
Google SlidesPPTX
4:3,16:9
Google SlidesPPTX
4:3,16:9
Google SlidesPPTX
4:3,16:9
Google SlidesPPTX
4:3,16:9
Google SlidesPPTX
4:3,16:9
Google SlidesPPTX
4:3,16:9
Google SlidesPPTX
4:3,16:9

Google SlidesPPTX
4:3,16:9
Google SlidesPPTX
4:3,16:9
Google SlidesPPTX
4:3,16:9
Google SlidesPPTX
4:3,16:9
Google SlidesPPTX
4:3,16:9
Showing 183–195 of 418 resources