Free thermometer chart for PowerPoint and Google Slides. 2 thermometer graphics with scale. Editable graphics with text placeholders.
Thermometer Chart
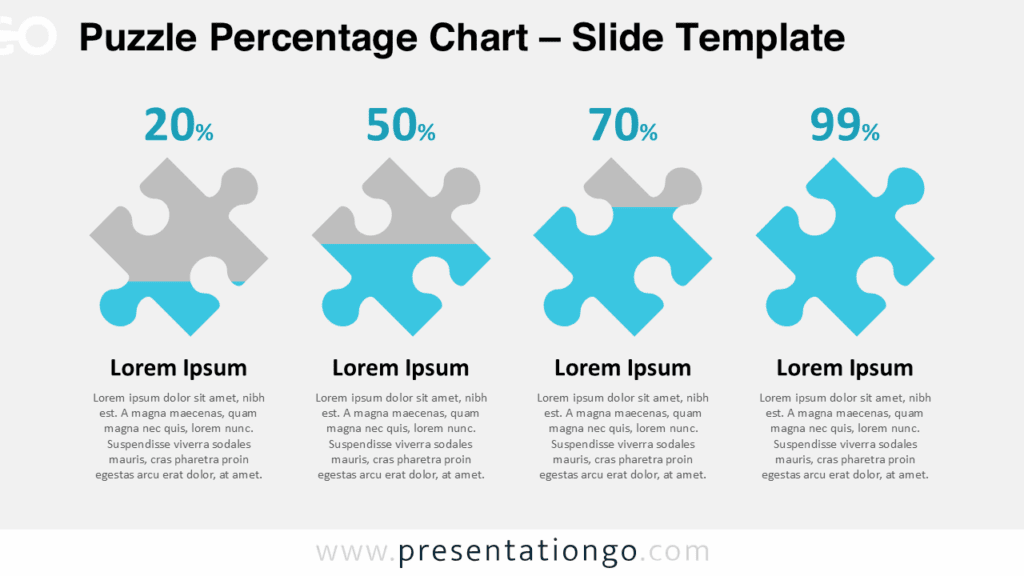
Use this infographic chart in your presentation to compare quantitative results.
Shapes are 100% editable: colors and sizes can be easily changed.
Usage instructions:
The PowerPoint (PPTX) version:
Built-in data driven PowerPoint chart: made with stacked column chart, you can easily change data series and format (e.g., colors).
Just right-click the chart to edit the data series (Edit Data):
The Google Slides version:
Adjust the height of the rectangular shape:

Includes 2 slide option designs: Standard (4:3) and Widescreen (16:9).
Widescreen (16:9) size preview:


This ‘Thermometer Chart for PowerPoint and Google Slides’ features:
- 3 unique slides
- Light and Dark layout
- Ready to use template with text placeholders
- Completely editable shapes
- PowerPoint version: Data-driven chart
- Standard (4:3) and Widescreen (16:9) aspect ratios
- PPTX file and Google Slides
Free fonts used:
- Helvetica (System Font)
- Calibri (System Font)