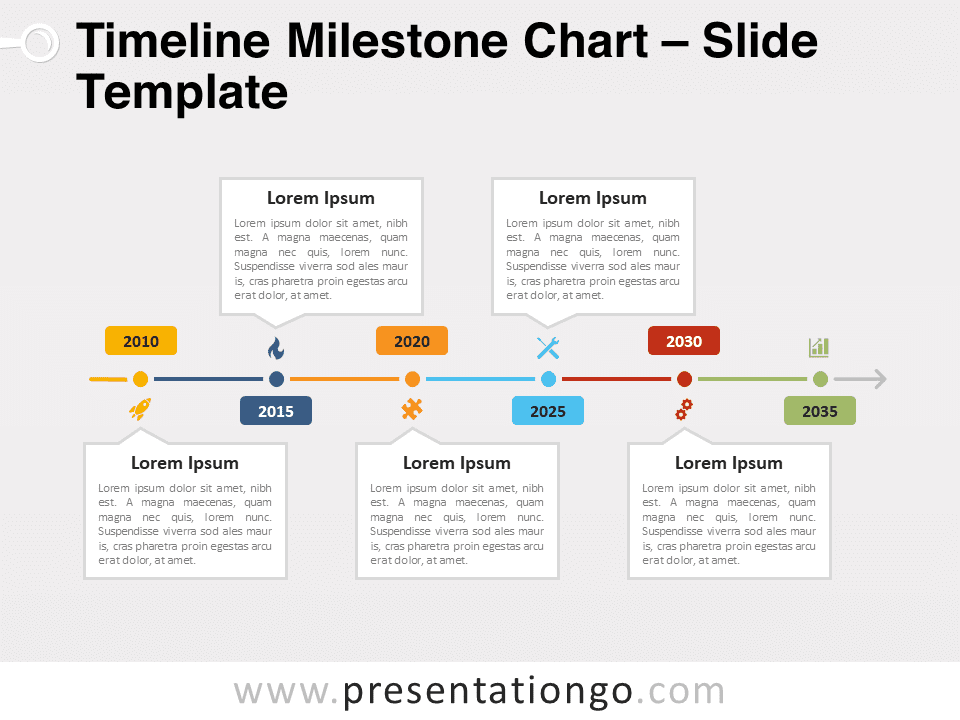
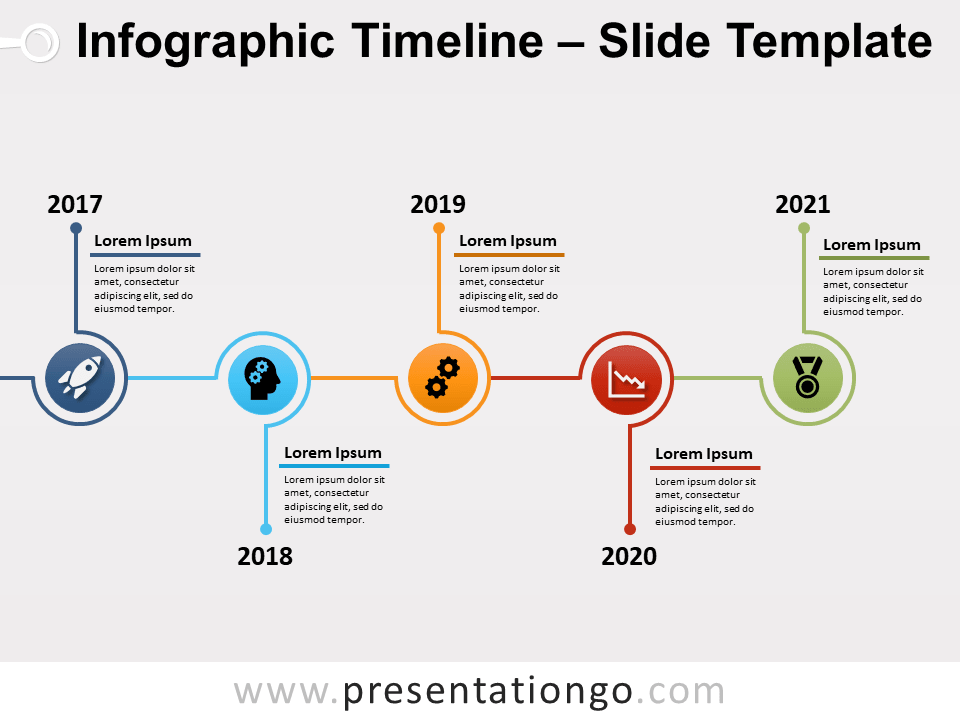
Streamline your presentations with our adaptable Timeline Milestone Chart for PowerPoint and Google Slides. This template’s sleek design and customizable features provide a clear visualization of your project’s key phases or historical data.
Timeline Milestone Chart
Our Timeline Milestone Chart features a clean, horizontal line punctuated by vibrant milestones, each marked with distinct colors and intuitive icons. Text boxes await your event descriptions, ensuring your timeline is both informative and engaging.
Enrich your presentations by using this chart to delineate project roadmaps, corporate growth, or historical events. It’s ideal for showcasing the evolution of ideas, illustrating a series of steps in a complex process, or mapping out strategic plans. This versatile diagram turns timelines into storytelling elements that captivate and inform audiences.
In summary, the Timeline Milestone Chart is an essential asset for any presenter. It transforms dates and developments into compelling narratives. With its full editability and dual layout options, it is tailored to elevate your presentation’s clarity and impact, leaving a lasting impression on your audience.
Widescreen (16:9) size preview:
This ‘Timeline Milestone Chart’ template features:
- 2 unique slides
- Light and Dark layout
- Ready to use template with icons and text placeholders
- Completely editable shapes
- Standard (4:3) and Widescreen (16:9) aspect ratios
- PPTX file (PowerPoint) and for Google Slides
Free fonts used:
- Helvetica (System Font)
- Calibri (System Font)
