Circles are probably the most perfect geometrical shapes. They are present everywhere in nature and for us humans, they are symbols of timelessness and completion, harmony, and perfection. This is why circular infographics will convey a positive and balanced image to your audience. Stop running around in circles to find the best templates. Here is a great selection of 10 free circular infographics for your next presentations!
There are infinite visual ways to present your lists, information, statistics, data, ideas, or concepts. A clear, professional, and attractive template will definitely help you get your message across. Indeed, you should not underestimate the power of visual memory! You need to think about the content but also about the form.
We know that circles are ideal to portray a continuing sequence of stages, tasks, or events in a circular flow. However, they have many more uses. For instance, you can illustrate ideas or concepts that are interconnected and act together in the same direction. You also have the possibility to represent a list of facts, phenomena, or data in a creative way. To give more personality to your presentations, our selection includes many original diagrams with circular shapes, such as a roundabout, a propeller, a staircase, a lifebuoy, or magnetic tapes. Take your pick and get ready for your next successful presentation on PowerPoint or Google Slides!
1. Non-directional Cycle Diagram
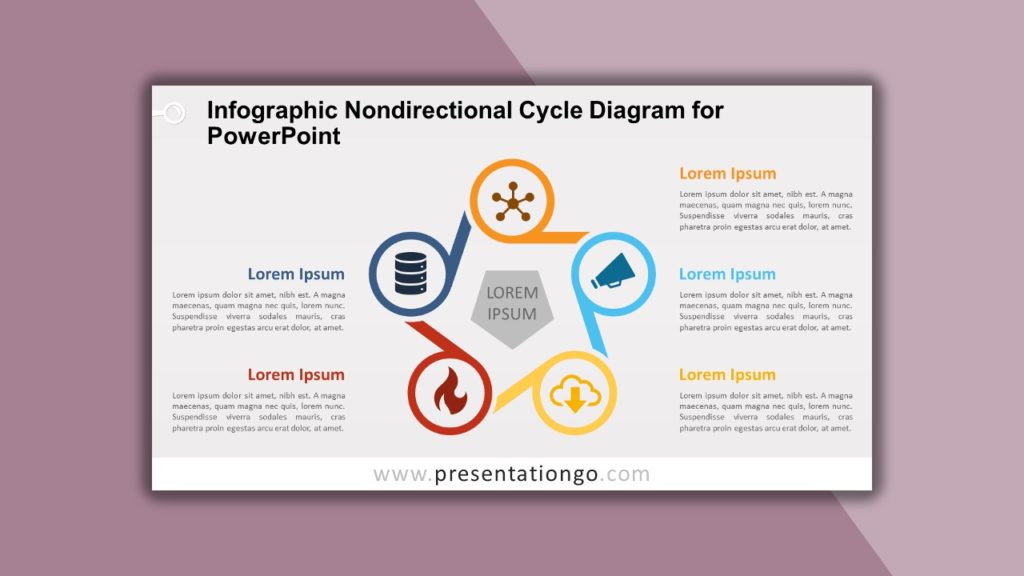
Do you need to share 5 great ideas and show their relation to a central concept? This free colorful infographic is a non-directional cycle diagram with a pentagon in the center to represent your main idea. You can use the 5 outer circles with magnetic tape-alike shapes to show a continuing sequence of 5 stages, tasks, or events in a circular flow. This diagram can also be useful to illustrate how 5 individual parts form a whole. Break the cycle of boring visual aids now!
2. 3-Blade Propeller
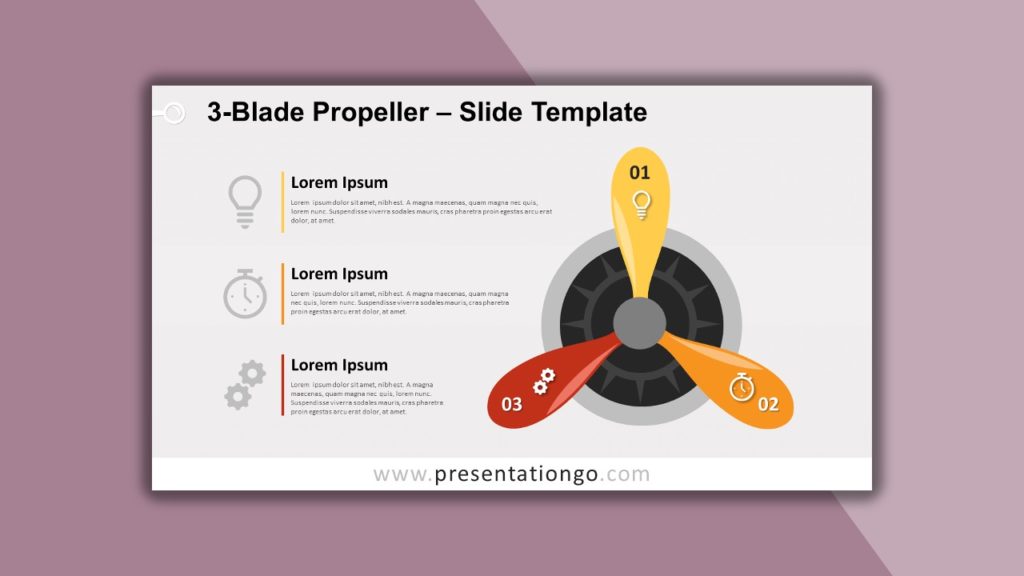
Need a little push to achieve a great presentation? This free diagram will bring some power to your ideas and propel them forward. This free 3-blade propeller slide for PowerPoint and Google Slides gives you 3 options to display your ideas and facts. Indeed, you can include numbers and icons on each blade. Moreover, you can describe your ideas thanks to the text placeholders. You can obviously enjoy this template for aviation, aeronautics, and engineering topics or in any field where forces work together towards a common goal or project.
3. Spiral Diagram
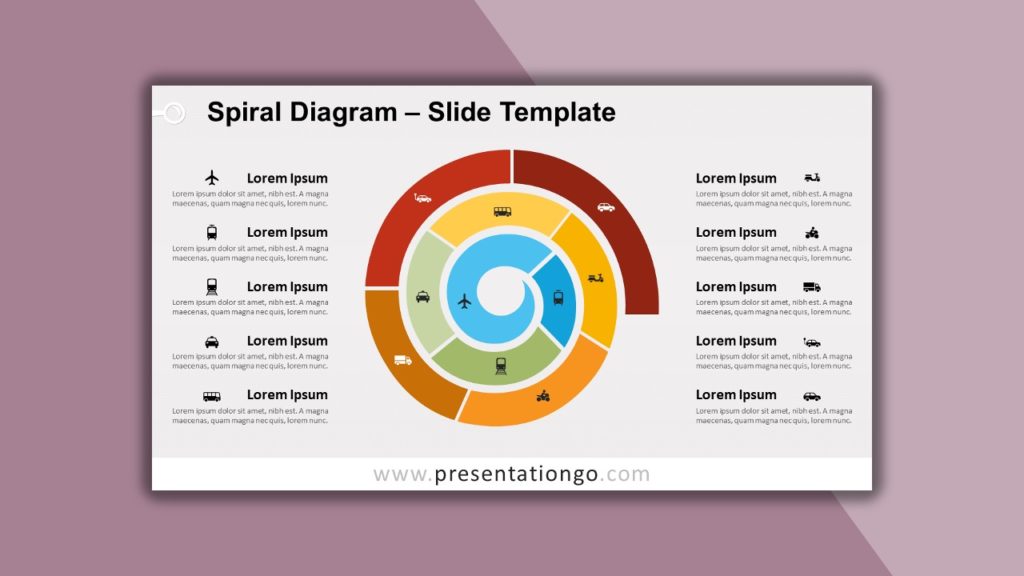
Have you ever seen a snail with 10 colors? Never? So, imagine the strong visual impression you will create on your audience with this shimmering Spiral diagram template. Your ideas will spiral up from one to the next with this shell-shape infographic with 10 steps. You can insert any icon inside each circular segment to illustrate your steps. Besides, the layout gives you plenty of room on each side to describe the 10 stages of your progression with titles and text.
4. Roundabout Road
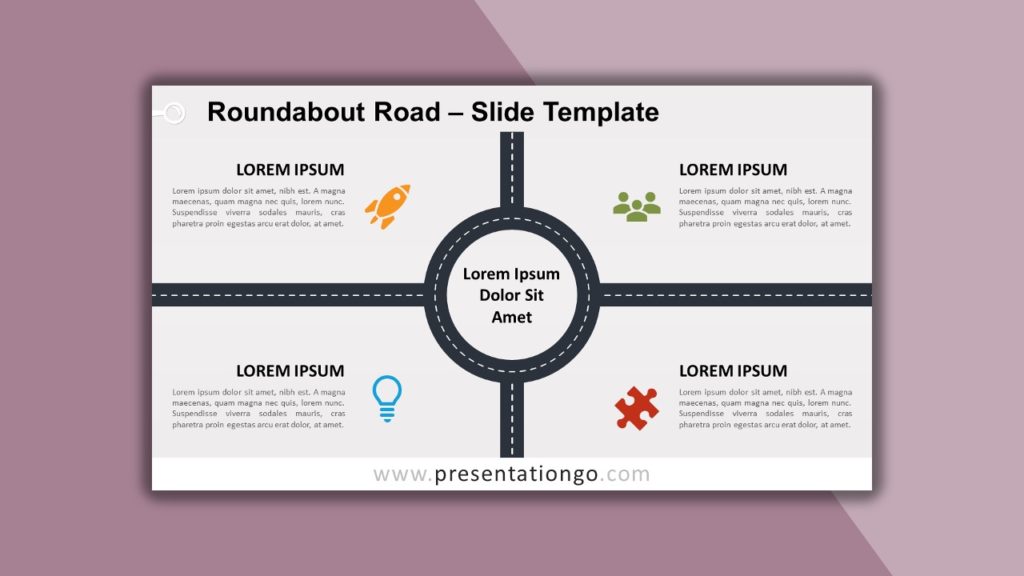
All roads lead to this creative free Roundabout template! Indeed, this design showcases 4 roads converging to a circular intersection. It allows you to write your main ideas in the central part of the page. Besides, the roads clearly divide the slide into 4 parts where you can insert icons, titles, and text to describe each one of your peripheral ideas in detail. These can converge or diverge from your main concept. Show the way to your audience and lead them to the crossroad where ideas meet!
5. Orbit List
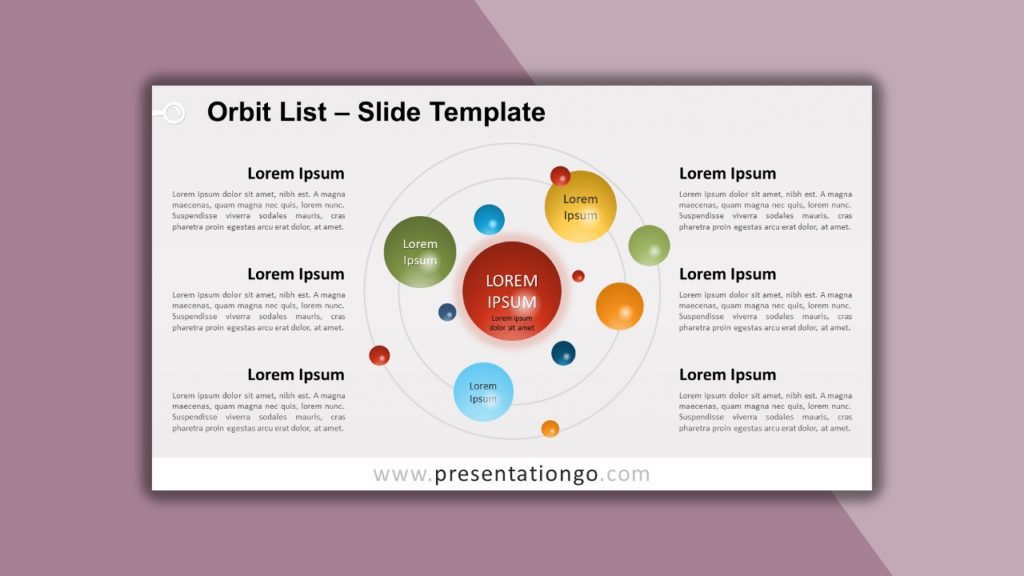
Time to put your ideas into orbit and make them travel to your audience at the speed of light! This template slide represents colorful spheres with a 3D effect that go around a central sphere which symbolizes your main idea or concept. Inspired by our system solar, the design made up of spheres of different sizes can illustrate ideas that are connected to a central one. Each side of the page offers 6 text placeholders to specify these ideas, concepts or groups of information.
6. Lifesaver Diagram
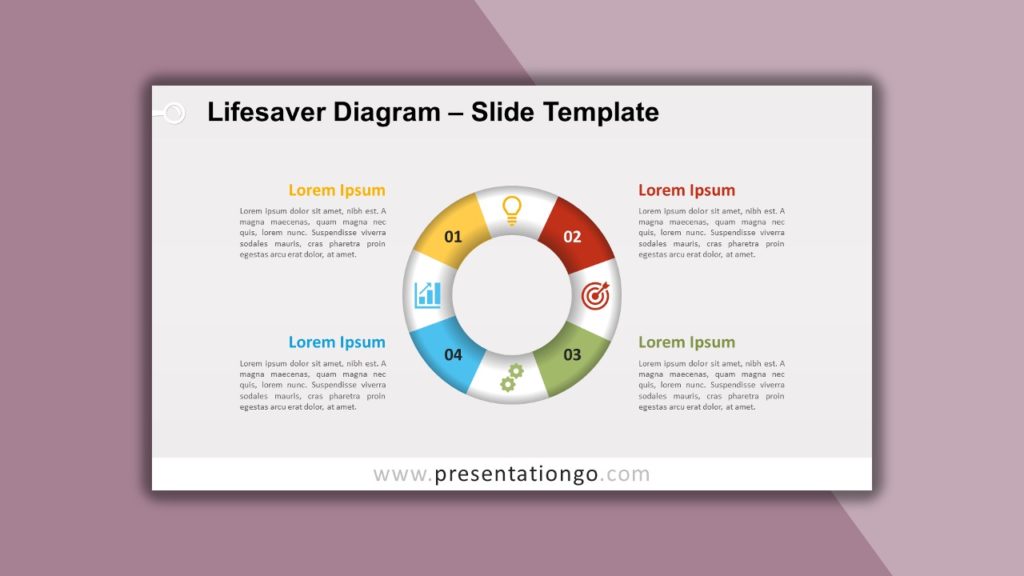
This free lifesaver diagram is not only a simple round-shaped infographic. The recognizable design of a lifebuoy implies the notions of helping, saving (the planet, money-saving), survival, self-preservation, and emergency. You can actually include numbers and icons with 4 different colors inside the life donut. You can therefore use this chart to represent a continuing sequence of 4 stages, tasks, or events in a circular flow, or 4 interconnected concepts. This creative slide will keep your presentation afloat!
7. Search Concept Diagram
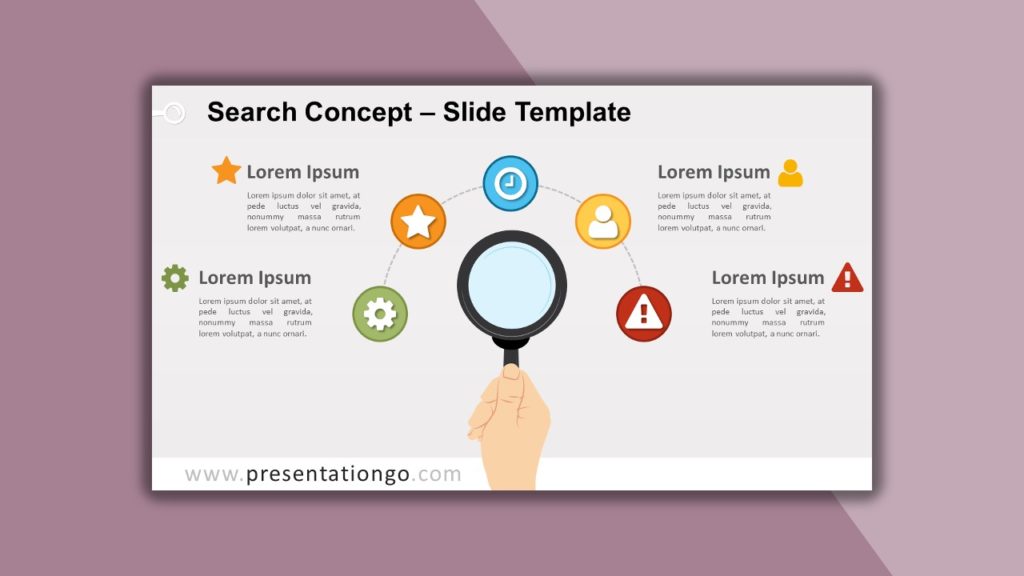
Do you want to illustrate ideas or findings based on thorough research and minute exploration? This Search Concept Diagram gives you the perfect visual aid to do just that. In the center of the page, we see a hand holding a magnifying glass, which serves as a metaphor for close examination. Around it, there are 5 circles arranged in a semi-circular shape. The 5 colorful bubbles, in which you can insert an icon, number, or text, will illustrate your ideas or steps of a process.
8. Infographic Arc Charts
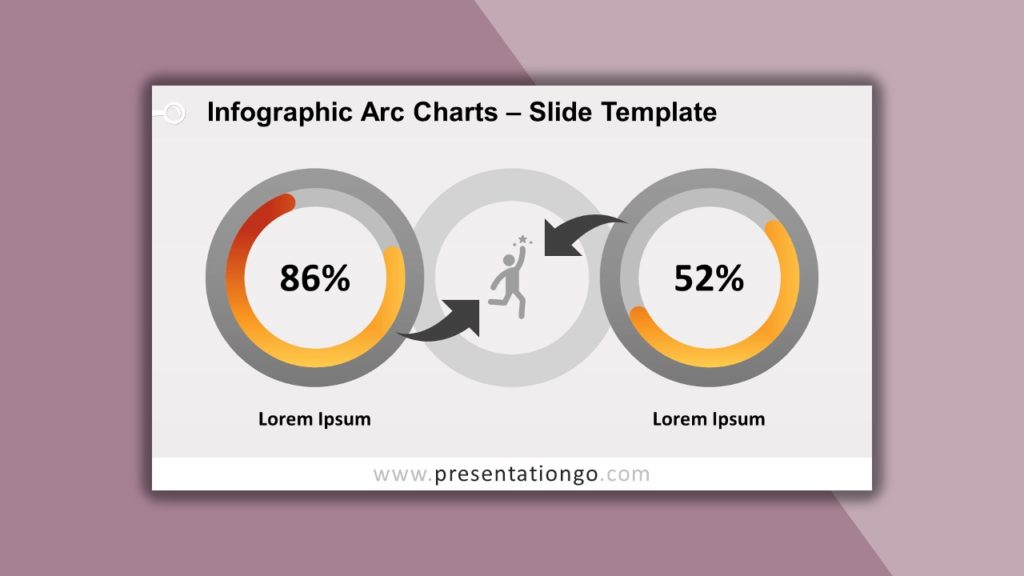
However simple this diagram may look, you won’t find a lot like these! Didn’t Leonardo Da Vinci say that simplicity is the ultimate sophistication? This slide is made up of 2 circular gauge charts that have the advantage of providing easy data reading. They are displayed side-by-side, so they are ideal to compare results, numbers, data, information, or statistics. You will also find a third ring standing between the other 2 discs, in which you can insert icons or texts to put both numbers or stats in relation.
9. Circular Staircase
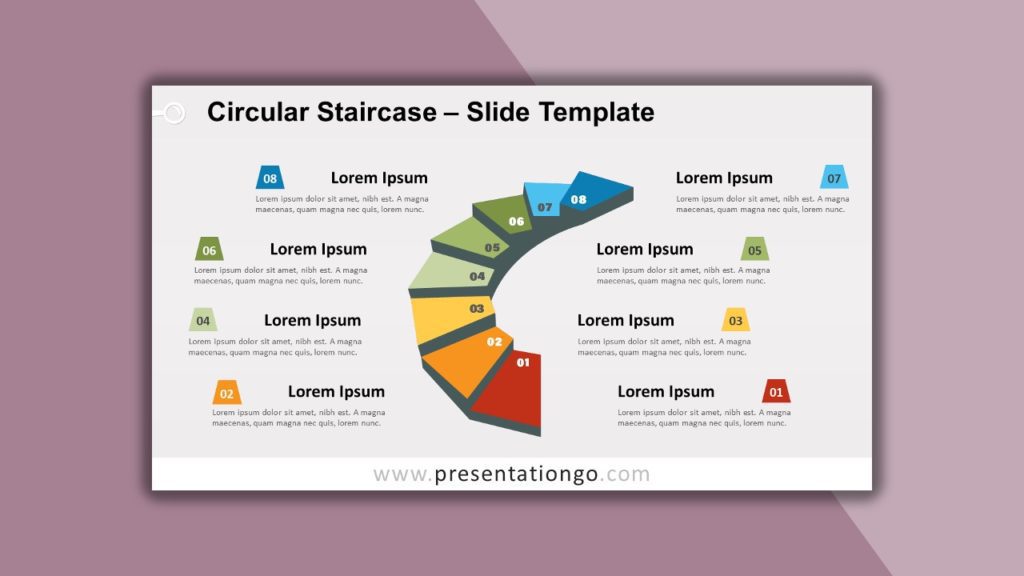
There goes your personal stairway to heaven! Indeed, this curved staircase with 8 colorful stairs will lead you to success. This infographic is a great metaphor to illustrate progress, leadership, human resources, career development, business growth, and teamwork. You can use it to describe an ascending or descending progression and incremental or sequential stages in a successful task, process, or workflow. In addition, you can enjoy this design to display a list of information with 8 ideas. Invite your audience to climb up the stairs of success!
10. Infographic Cycle Diagram
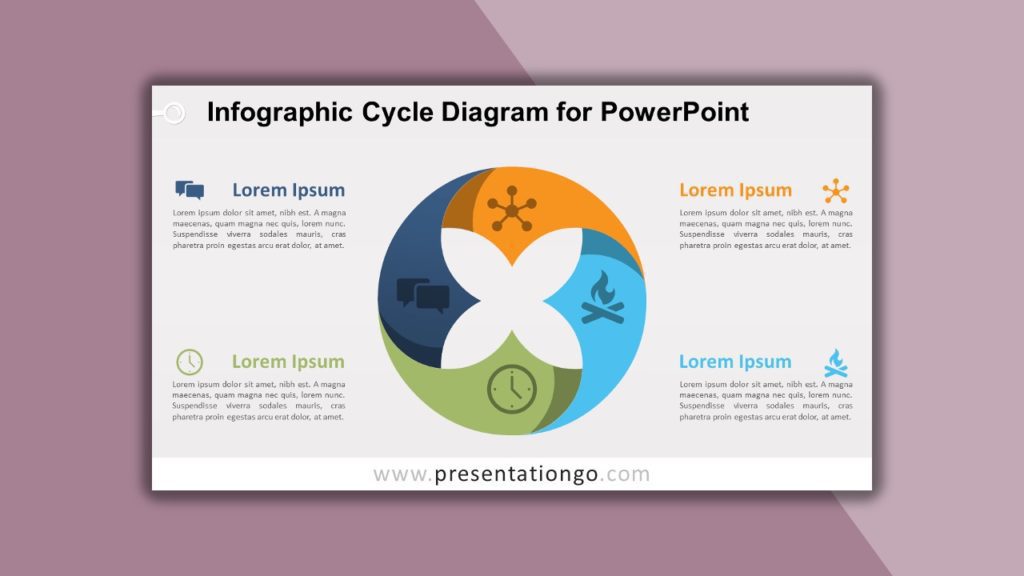
The original shape of this free Infographic Cycle Diagram is creative, harmonious, and dynamic! It offers a great layout to show how 4 individual parts form a whole, how 4 ideas or items of information are interconnected, and even as a matrix. The circular chart indeed consists of 4 parts with distinct colors. Besides, they form a beautiful 4-petal-flower shape in the center. This original tool will be the 4-leaf clover of your next presentation!
We hope you like our selection of the 10 Great Templates of Circular Infographics for Presentations.
