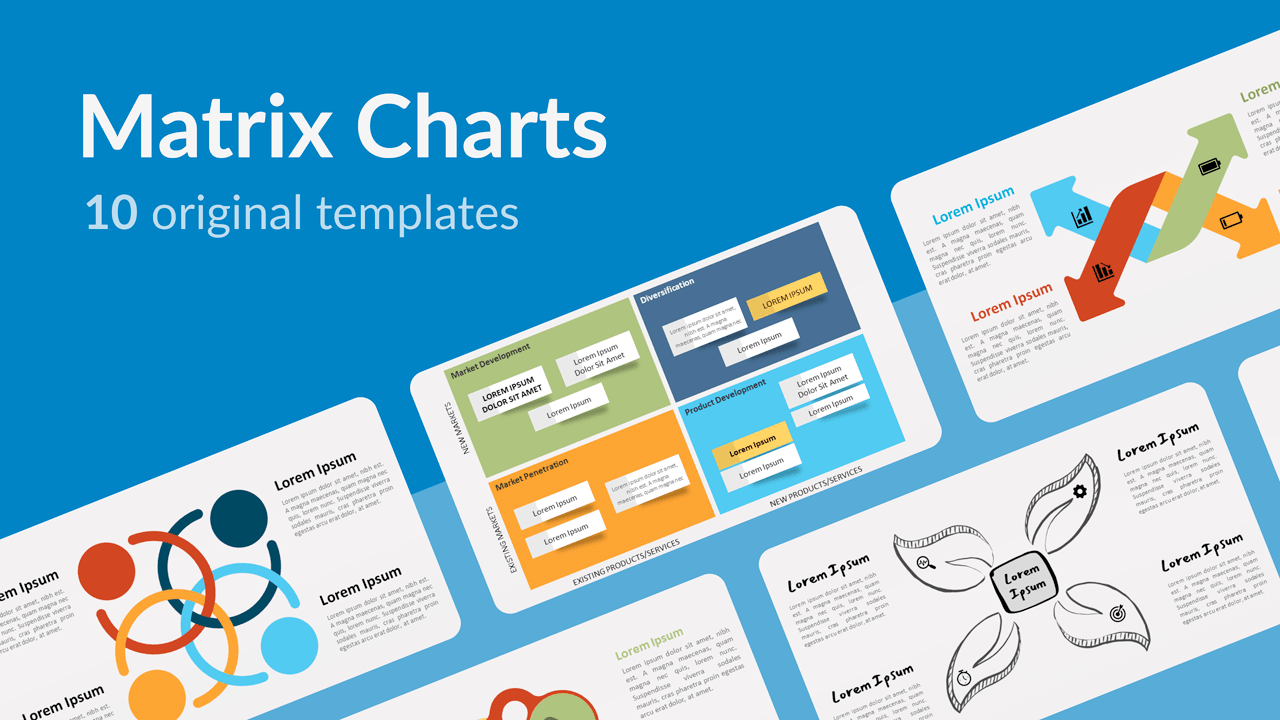
Matrix charts are part of the basic toolkit of your professional presentations. However often you might use them, it is sometimes difficult to come across an inventive template to showcase your facts, variables, or results. That is why we offer you 10 original matrix chart templates that will help you impress your audience. Welcome to the matrix!
Matrix charts are designed to present interactions between two or more variables. Basically, they are tables made up of columns and rows that show information and crosstabulation results. The aim, of course, is to simplify the visualization of data that can be sometimes difficult to illustrate and explain.
Matrix diagrams are frequently used by project managers to showcase complex relationships and connections in their processes and programs. The types of information you can manage are limitless: data, actions, concepts, functions, and even people. This planning tool is ideal to keep your projects on track and expose your findings in a clear manner.
Matrix charts have a wide number of applications: identify causes, consequences, opportunities, and requirements, compare data and solutions, analyze data, and quality function deployment. Now the matrix won’t have any secrets for you thanks to these free Matrix Chart templates.
1. Matrix Diagram with Connected Circles

“Everything the power of the world does is done in a circle”, said Heȟáka Sápa, commonly known as Black Elk. This matrix chart gives you the power to illustrate this phenomenon. All 4 circles are closely connected thanks to a stream-like design. It is indeed ideal to represent a continuing sequence of 4 stages, tasks, or events in a circular flow. You can also use it to represent the interrelation and interdependence of each step, idea, or fact.
2. Kite Matrix Diagram

Let your ideas fly as high as a kite! This kite-shaped matrix diagram is a creative way to display your results. The colorful diamond kite contains 4 parts (2×2 cells) and 4 icons you can edit to your liking. Besides, the text placeholders will allow you to specify your findings or results. This four-quadrant matrix diagram is ideal for business or marketing matrices like BCG, SWOT, Ansoff, and risk assessment… Of course, it is also perfectly suited for any presentation related to the leisure industry.
3. Cycle Matrix and Cubes

This design is certainly one of the most original and powerful we can offer you! This free cycle matrix diagram and cubes for PowerPoint and Google Slides is made up of a 4-quadrant diagram from which 4 pillars emerge. Indeed, these colorful cubes seem to be jumping out of the screen thanks to the 3D perspective. On top of these columns, you can highlight your icons. Moreover, this layout gives you enough space for you to display your titles and texts on the side. The perfect tool for a solid and surprising matrix presentation!
4. Arrow Ribbons
How to express a complex idea with a simple graphic? This free Arrow Ribbons slide will be of great help to achieve this. It shows intertwined arrows, 2 of them pointing upwards and 2 downwards. This template can be used as a classical matrix chart. However, this illustration is also ideal to compare 2 opposite ideas or contrasting concepts such as “positive vs. negative” or “strengths vs. weaknesses”. Slide number 2 is specially designed for that purpose with only the red color for negative elements and the green color for positive ones. Add a new arrow in your quiver thanks to this free slide!
5. Doodle Matrix with Leaves

Surprise your audience with this unusual template for a matrix chart. Forget about colorful and geometrical shapes: this free doodle matrix with leaves represent black and white sketches of 4 leaves surrounding a central idea. This symbolical design is perfect if you want to convey confidence, peacefulness, and a positive attitude to your audience. In addition, the original font contributes to this impression. Nonetheless, every element of this template is entirely editable. Turn over a new leaf and try this Doodle Matrix with Leaves slide template.
6. Matrix Circle Relationship

No doubt that sooner than later you will need this diagram for your presentations. Its almost limitless applications make it an indispensable tool. You can indeed use it as a classical matrix with 4 factors and sub-factors or as a radial diagram to show the relationship between 4 elements of information and a central idea. You can also employ this illustration as a hyperbolic tree, perfect to display hierarchical data or even a concept map.
7. Woven Matrix

Matrix charts are usually straightforward and easy to decipher. However, sometimes you like to show your audience that not everything is as simple as it seems. This free woven matrix diagram showcases a braided woven stripe effect. This allows you to illustrate the sometimes complex and close interconnections of all the elements you want to display. Weave your magic and impress your audience with this professional Woven Matrix design!
8. Ansoff Matrix

The Matrix created by Igor Ansoff has become one of the most widespread marketing tools. By analyzing markets and products, it helps companies and organizations to understand the business development and the marketing strategy. Why not use our clear and colorful Ansoff Matrix slide template to expose clearly your strategic planning? Thanks to the sticky notes, you can expose your ideas in all 4 quadrants (market penetration, product development, market development, and diversification).
9. BCG Matrix

This free BCG matrix template for PowerPoint and Google Slides will be a perfect complement to the Ansoff Matrix. The BCG Matrix is also a marketing tool that aims at helping companies decide how to prioritize their businesses. Also known as the Growth-Share Matrix, it offers you a four-quadrant table ready to be used. You just need to use the sticky note labels representing the divisions or business units of your organization on the matrix.
10. Abstract Teamwork

Do you need the perfect visual metaphor for successful teamwork? Time to download our free Abstract Teamwork matrix for PowerPoint and Google Slides. This minimalist and colorful design shows 4 human silhouettes seen from above. The circles represent the heads and the arcs, the intertwined arms. Although it functions perfectly as a matrix, it can also be applied to express concepts of friendship, companionship, connection, cooperation, networking, partnership, solidarity, spirit, strength, and collective success.
