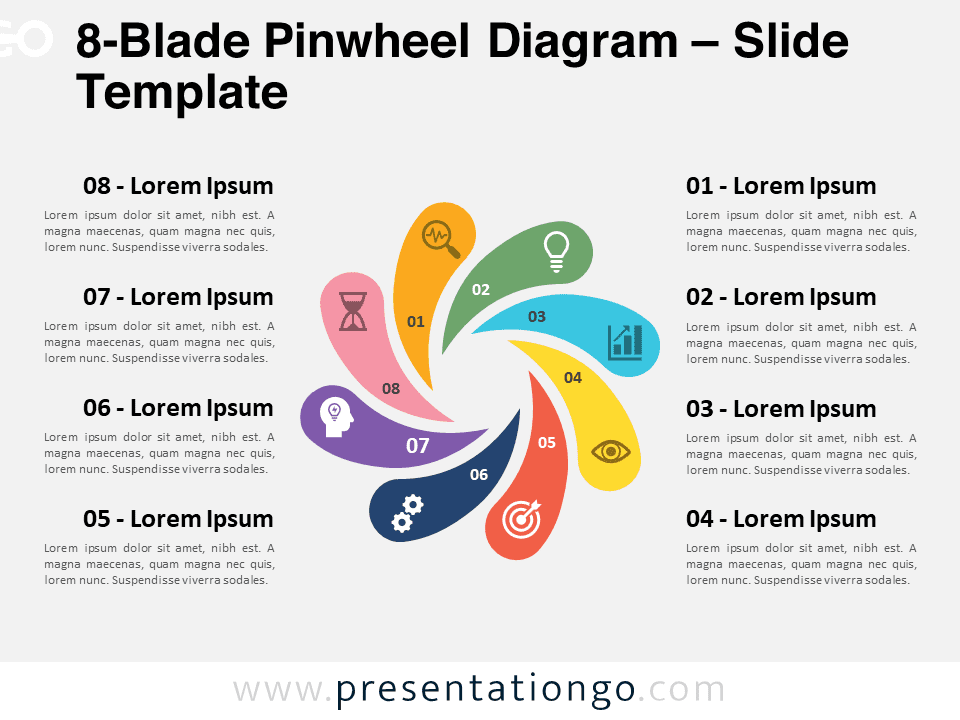
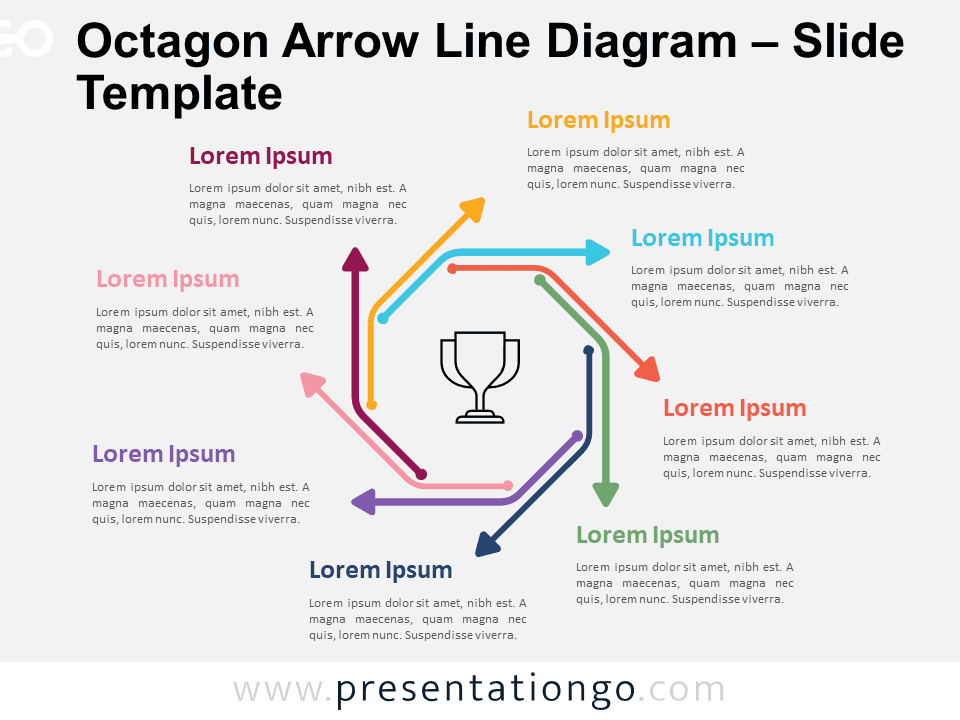
The 8-Blade Pinwheel Diagram showcases is a versatile, circular flow diagram with eight segments for PowerPoint and Google Slides.
Pinwheel-Style Flow Chart for Presenting Eight-Stage Cycles
Cycle process diagrams illustrate recurring processes or stages in a continuous flow. This template features a pinwheel-like design with eight color-coded segments branching out from the center, each with a unique icon and corresponding numbered text block for easy association and customization.
This versatile template is ideal for business professionals, educators, and consultants looking to present cyclical processes, such as project management cycles, product life cycles, or iterative design processes. For instance, a marketing manager could use this diagram to showcase an eight-stage customer journey, from awareness to loyalty, helping stakeholders understand the key touchpoints and strategies at each phase. The template’s clear structure and visual cues enable audiences to grasp the cyclical nature of the process quickly.
The presentation document includes two unique slides pre-populated with icons, numbers, and text placeholders. Users have full control over the customization of shapes and can choose between light and dark themes. The template is available in both Standard (4:3) and Widescreen (16:9) ratios and comes in both PowerPoint PPTX and Google Slides formats. To personalize the template, users can easily modify the colors, fonts, and icons to align with their brand guidelines or presentation theme.
Download the 8-Blade Pinwheel Diagram and effectively communicate cyclical processes to your audience.
Widescreen (16:9) size preview:
This template offers:
- 2 unique slides
- Options for both light and dark themes
- Pre-populated with icons, numbers and text placeholders
- Fully customizable shapes for complete control
- Available in both Standard (4:3) and Widescreen (16:9) ratios
- Offered in both PowerPoint PPTX and Google Slides formats


