The Abstract Fishbone Diagram is a visually structured template for PowerPoint and Google Slides, designed to facilitate a systematic analysis of cause-and-effect relationships.
Structured Design for Effective Cause-and-Effect Analysis
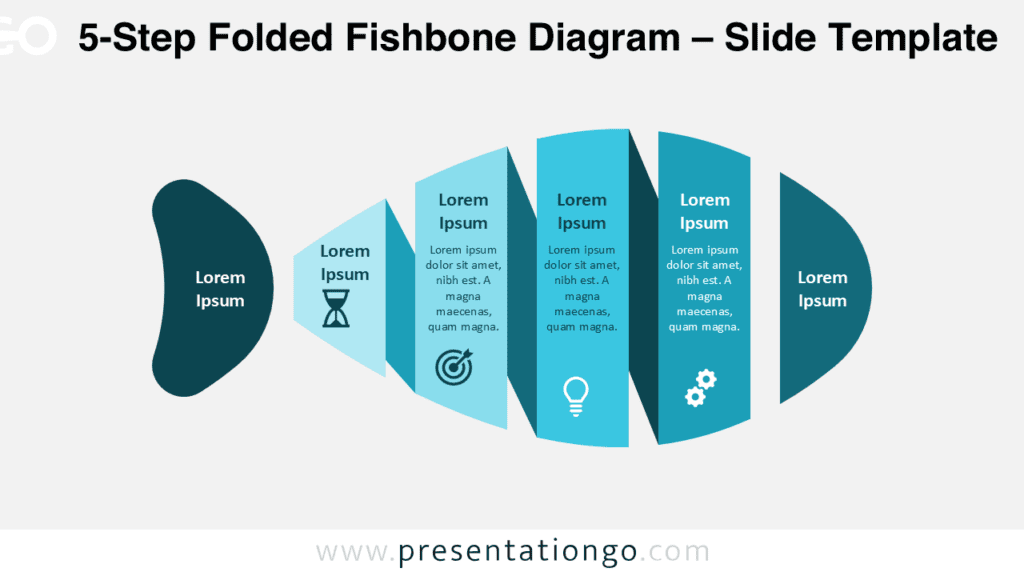
The diagram features a central horizontal arrow. This arrow represents the main issue or effect. On either side, there are four triangular segments. Each segment is numbered and designated for categorizing contributing factors. Each segment provides ample space for titles, descriptions, and bullet points. Users can detail specific causes under each category.
The clear and organized layout guides the audience through the analysis process. It ensures a logical sequence and promotes a thorough understanding of the problem. Additionally, the template’s structured format helps presenters systematically identify and discuss various contributing factors. This approach fosters effective problem-solving and decision-making.
Ishikawa Fishbone Diagrams, also known as cause-and-effect diagrams, are widely used in many fields. These fields include quality management, project planning, and root cause analysis. They help teams identify, categorize, and prioritize potential causes of a problem or effect. This facilitates a comprehensive understanding of the issue. By using this template in presentations, users can effectively communicate complex cause-and-effect relationships. This engages their audience and drives meaningful discussions. The template’s versatility makes it suitable for various industries and contexts. These range from manufacturing and healthcare to education and business management.
The template includes two unique slides. It comes pre-populated with numbers and text placeholders. It offers fully customizable shapes for complete control. Users can choose between light and dark themes. They can also select Standard (4:3) or Widescreen (16:9) ratios. The template is available in both PowerPoint PPTX and Google Slides formats. Users can easily modify titles, descriptions, and colors to suit their specific presentation needs.
Download the Abstract Fishbone Diagram template and streamline your cause-and-effect analysis for impactful presentations.
Widescreen (16:9) size preview:


This template offers:
- 2 unique slides
- Options for both light and dark themes
- Pre-populated with numbers and text placeholders
- Fully customizable shapes for complete control
- Available in both Standard (4:3) and Widescreen (16:9) ratios
- Offered in both PowerPoint PPTX and Google Slides formats