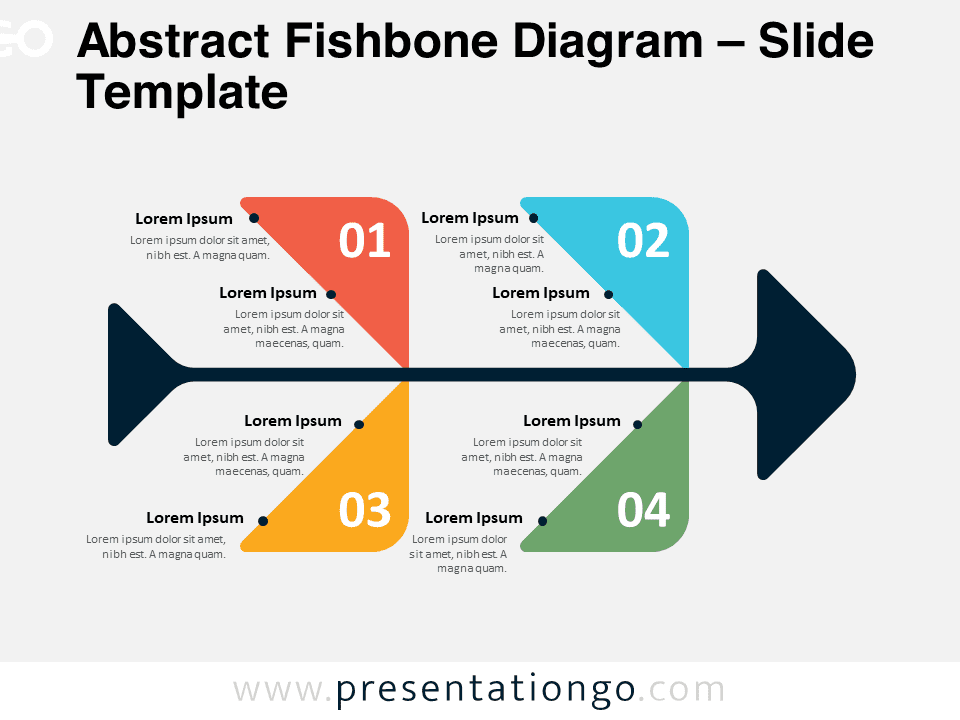
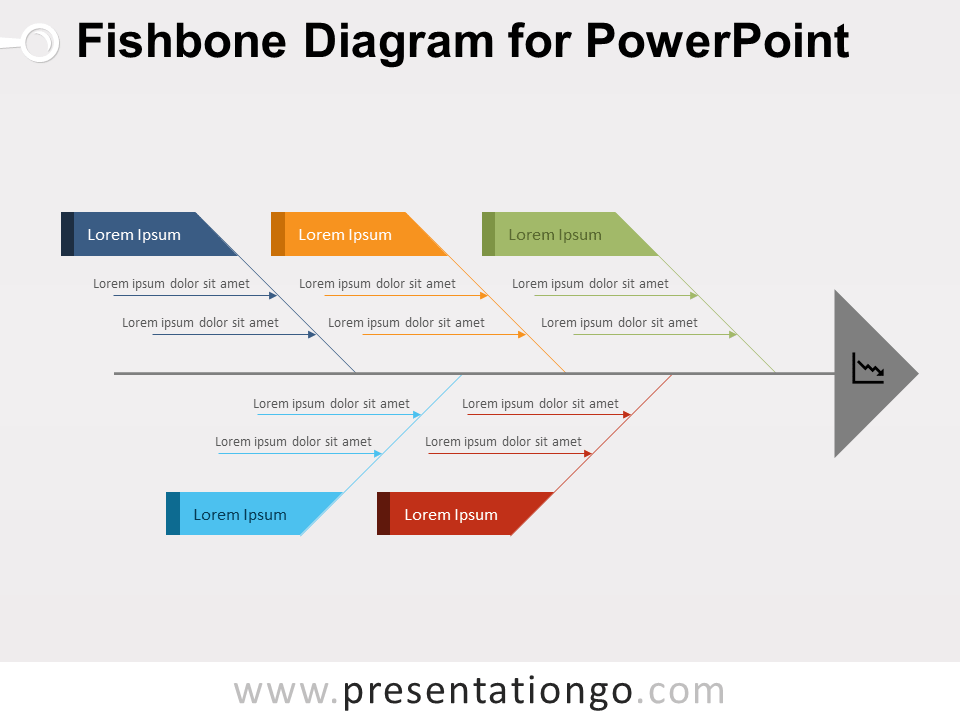
Free fishbone diagram for PowerPoint and Google Slides. A cause and effect diagram featuring a simple fish skeleton. Editable graphics with text placeholders.
Fishbone Diagram
The fishbone diagram aka Ishikawa diagram usually helps find the root causes of a problem. Furthermore, it will help you structure and organize information about a problem and its causes. Therefore, this diagram list all the actual reasons for and causes of the unsatisfactory situation.
In the end, the fishbone diagram makes this information easier to analyze and also for you to present and explain in a slide.
More specifically, the head of the fishbone represents the problem you want to investigate. Use the spines to list all the likely causes, and regroup them into categories (i.e., the colorful text boxes).
That simple yet efficient diagram is great to share insights with your team about an issue. It can also be the starting point of a brainstorming meeting aimed at gathering ideas.
Shapes are 100% editable: colors and sizes can be easily changed.
Includes 2 slide option designs: Standard (4:3) and Widescreen (16:9).
Widescreen (16:9) size preview:
This ‘Fishbone Diagram for PowerPoint and Google Slides’ features:
- 2 unique slides
- Light and Dark layout
- Ready to use template with text placeholders
- Completely editable shapes
- Standard (4:3) and Widescreen (16:9) aspect ratios
- PPTX file and for Google Slides
Free fonts used:
- Helvetica (System Font)
- Calibri (System Font)


