Free Ishikawa fishbone diagram for PowerPoint and Google Slides. A visual metaphor for cause and effect analysis. Editable graphics with numbers, icons, and text placeholders.
Ishikawa Fishbone Diagram
Time to modernize your Ishikawa diagrams with a great design! If you want to show the different potential causes of an event, then download this free Ishikawa Fishbone Diagram template!
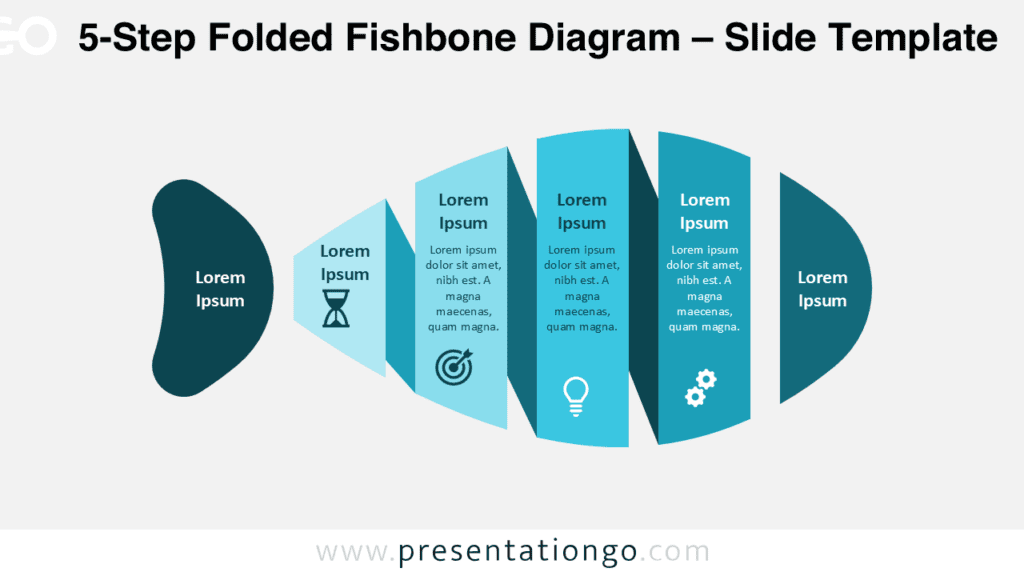
This slide shows a large fishbone with a gray head, vertebral column, and head. The fish skeleton is completed by 4 vertebral arches aligned in a horizontal way. These will represent your 4 or 8 options to illustrate the 4 or 8 causes that will lead to a consequence. You can indeed write a figure from 1 to 4 on each bone to number your causes. Finally, you can name your 4 or 8 causes, reasons or origins with text placeholders you can find at the end of each rib.
Ishikawa diagrams are classics of business presentations since they show the causes of a process and event. Indeed, this free Ishikawa Fishbone Diagram template is a great tool to show the evolution that can lead either to failure or success!
Shapes are 100% editable: colors and sizes can be easily changed.
Includes 2 slide option designs: Standard (4:3) and Widescreen (16:9).
Widescreen (16:9) size preview:


This ‘Ishikawa Fishbone Diagram’ template features:
- 2 unique slides
- Light and Dark layout
- Ready to use template with numbers, icons, and text placeholders
- Completely editable shapes
- Uses a selection of editable PowerPoint icons
- Standard (4:3) and Widescreen (16:9) aspect ratios
- PPTX file (PowerPoint) and for Google Slides
Free fonts used:
- Helvetica (System Font)
- Calibri (System Font)