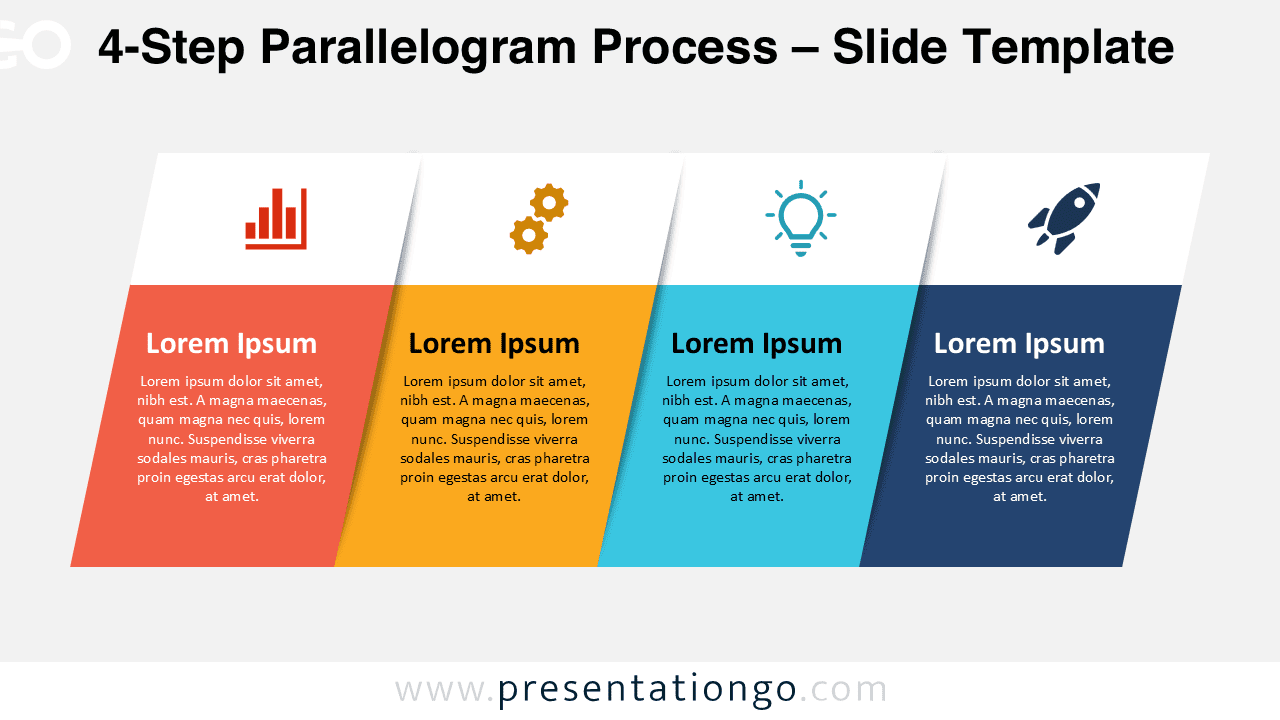
Skip to content
PresentationGO
  • Explore
    • Templates
      • Abstract
      • Sports
      • Business
      • Religion & Holidays
      • Nature
      • Technology
      • Professions
      • Flat Lays & Scenes
      • Health & Recreation
      • Color Palettes
      • Education
      • Food & Drink
      • Science
      • CertificatesNEW
      • All Templates
    • Charts & Diagrams
      • Processes
        • Circular
        • Linear
        • Alternating
        • Stairs
        • Bending
      • Funnels
      • Pyramids
      • Matrix Charts
      • Business Models
      • Non-Data-Driven Chart Alternatives
      • Radial Diagrams
      • Flow Charts
      • Data-Driven Charts & Graphs
      • Organizational Charts
      • Clusters & Relationships
      • Venn Diagrams
      • All Charts & Diagrams
    • Text & Tables
      • Text Boxes
      • Comparisons
      • Paper & Banners
      • Numbered Lists
      • Speaking Bubbles
      • Pricing Tables
      • Bullet Point / Text Layouts
      • Contents & Table of Contents
      • Quotes
      • Word Clouds
      • To-do & Checklists
      • All Text & Tables
    • Timelines & Planning
      • Calendars
      • Timelines
      • Gantt Charts
      • Agenda
      • All Timelines & Planning
    • Graphics & Metaphors
      • Concepts
      • Silhouettes & People
      • Light Bulbs
      • Trees
      • Letters & Numbers
      • Signs
      • Mockups
      • Food
      • Money
      • Road
      • Target and Goals
      • All Graphics & Metaphors
    • Maps & Flags
      • Flag Templates
      • Continent Maps
      • Country Maps
        • Africa
        • Asia
        • Australia / Oceania
        • Europe
        • North America
        • South America
      • World Maps
      • All Maps
    • AI ImagesNEW
  • Search by
    • Colors
      • Black
      • Blue
      • Brown
      • Gray
      • Green
      • Cream
      • Light Blue
      • Orange
      • Pink
      • Purple
      • Gold
      • Red
      • White
      • Yellow
      • Teal
    • Steps (Options)
      • 2 options
      • 3 options
      • 4 options
      • 5 options
      • 6 options
      • 7 options
      • 8 options
      • 9 options
      • 10 options
      • 12 options
  • Templates
  • Charts & Diagrams
  • Text & Tables
  • Timelines & Planning
  • Graphics & Metaphors
  • Maps & Flags
  • AI ImagesNEW
Charts & Diagrams > Processes > Linear

Linear

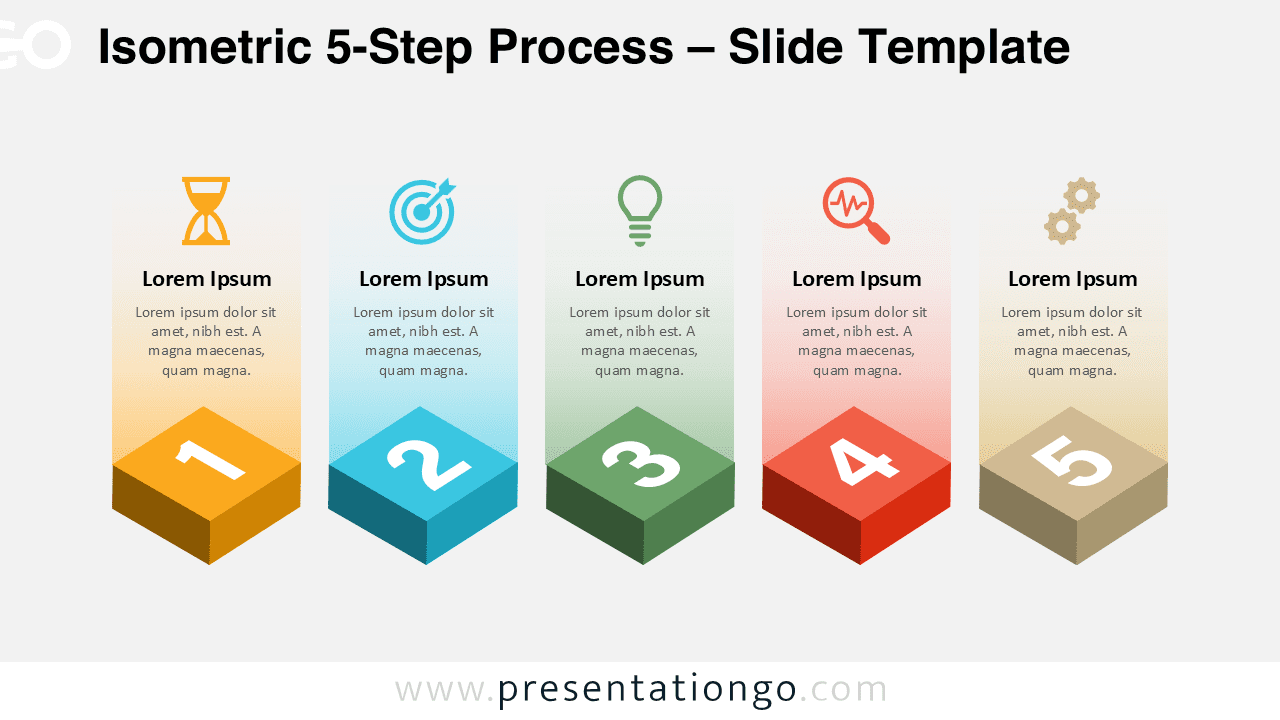
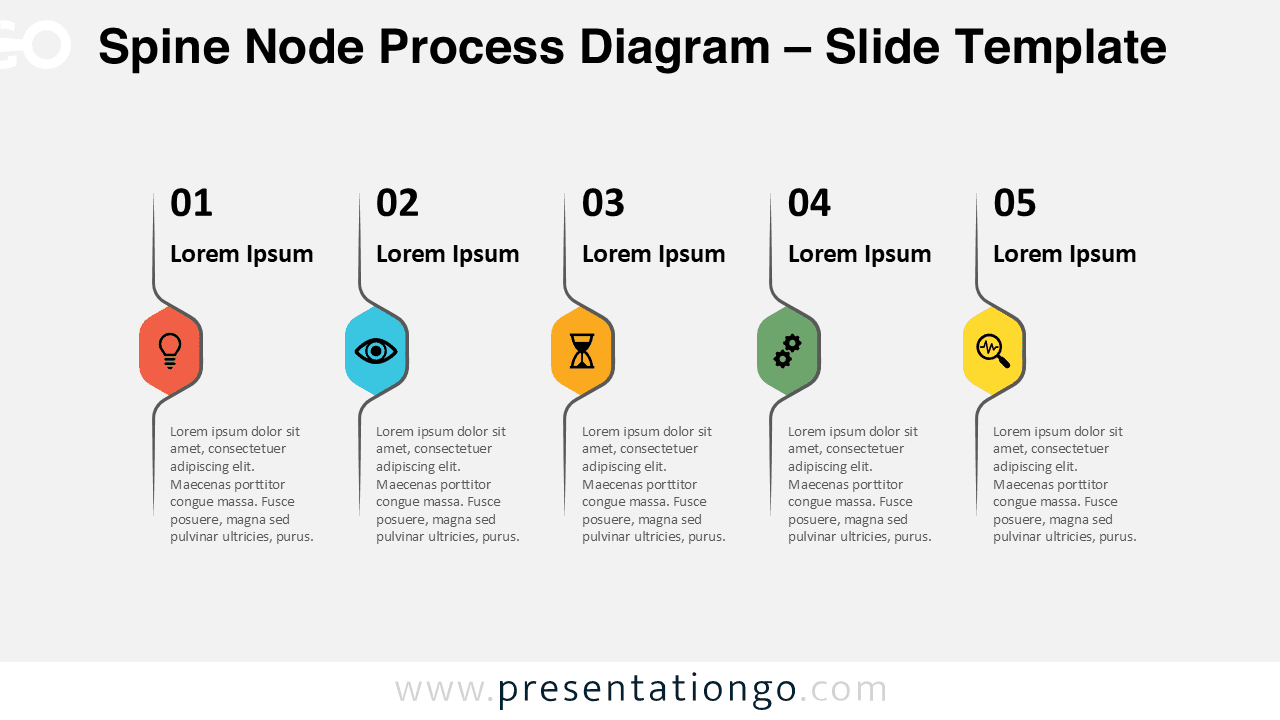
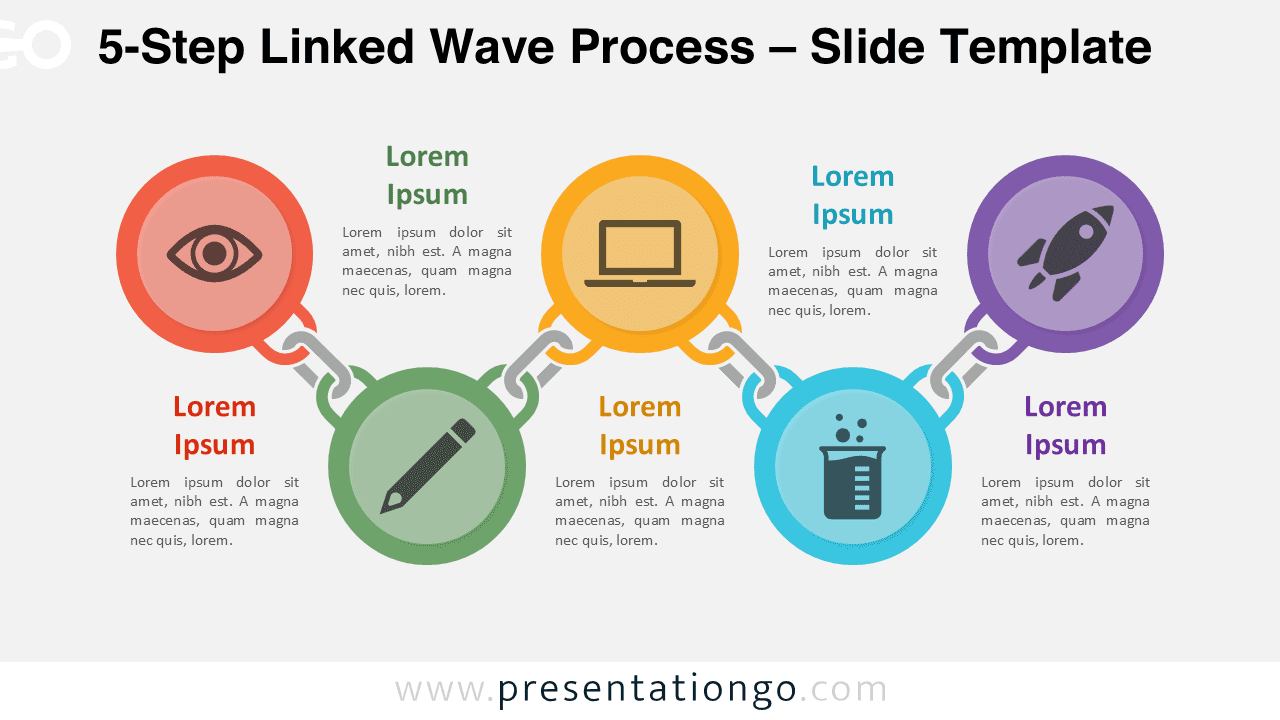
Linear process diagrams visually represent a sequence of steps or actions in a straight line. With 272 templates available, you can easily illustrate workflows, timelines, or any sequential process in your PowerPoint or Google Slides presentation, ensuring your audience follows along effortlessly.

Vertical arrow process diagram with four steps for PowerPoint and Google Slides used to explain workflows or methodologies.
Charts & Diagrams
4 options

4-Step Vertical Arrow Process

Present four-step processes in PowerPoint and Google Slides using curved vertical arrows and editable icons.

Google Slides, PPTX

16:9

Vertical arrow diagram with three steps for PowerPoint and Google Slides designed to present structured workflows clearly.
Charts & Diagrams
3 options

3-Step Vertical Arrow Process

Visualize three-step workflows in PowerPoint and Google Slides using curved vertical arrows and editable shapes.

Google Slides, PPTX

16:9

Vertical arrow process diagram with two steps for PowerPoint and Google Slides, showing a clean layout with editable arrows and icons.
Charts & Diagrams
2 options

2-Step Vertical Arrow Process

Visualize two-step workflows in PowerPoint and Google Slides using a vertical arrow process diagram with editable shapes.

Google Slides, PPTX

16:9

Six-step multi-lane process slide for PowerPoint and Google Slides featuring perspective lanes, icons, editable shapes, and figures ideal for parallel workflow presentations.
Charts & Diagrams
6 options

6-Step Perspective Multi-Lane Diagram

A six-lane perspective diagram for PowerPoint and Google Slides to present complex multi-step workflows.

Google Slides, PPTX

16:9

Five-step multi-lane process slide for PowerPoint and Google Slides featuring perspective lanes, icons, editable text, and figures for presenting parallel workflows.
Charts & Diagrams
5 options

5-Step Perspective Multi-Lane Diagram

A five-lane perspective diagram for PowerPoint and Google Slides to present multi-step workflows.

Google Slides, PPTX

16:9

Four-step multi-lane process slide for PowerPoint and Google Slides featuring perspective lanes, editable shapes, icons, and figures for presenting parallel workflow steps.
Charts & Diagrams
4 options

4-Step Perspective Multi-Lane Diagram

A four-lane perspective diagram for PowerPoint and Google Slides to present structured multi-step workflows.

Google Slides, PPTX

16:9

Three-step multi-lane process slide for PowerPoint and Google Slides featuring perspective lanes, icons, and editable shapes for presenting parallel workflow steps.
Charts & Diagrams
3 options

3-Step Perspective Multi-Lane Diagram

Visualize three related steps with this perspective lane diagram for presentations.

Google Slides, PPTX

16:9

Complete Arrow Target Progress Diagram in PowerPoint and Google Slides with five multicolored targets aligned along a horizontal path for goal-focused presentations.
Charts & Diagrams
5 options

Arrow Target Progress Diagram

A five-step Arrow Target Progress Diagram for PowerPoint and Google Slides to present goals, objectives, and milestones with clarity and impact.

Google Slides, PPTX

16:9

Slide view of the 4-step directional workflow diagram for PowerPoint and Google Slides, showing arrows, icons, and color-coded steps for clear presentation flow.
Charts & Diagrams
4 options

4-Step Directional Workflow

Present four steps clearly using this directional workflow diagram featuring outlined arrows and icons.

Google Slides, PPTX

16:9

Light background version of 8-step converging arrow diagram showing unity and progress in PowerPoint and Google Slides presentations.
Charts & Diagrams
8 options

8-Step Converging Arrow Process

Visualize long processes with eight colorful arrows converging into a single direction — perfect for business and strategy presentations.

Google Slides, PPTX

16:9

Light background version of 6-step converging arrows showing alignment and focus in PowerPoint and Google Slides business presentations.
Charts & Diagrams
6 options

6-Step Converging Arrow Process

Present six connected steps converging into one direction to highlight alignment and progress in your project workflow.

Google Slides, PPTX

16:9

Clean light background version of 4-step converging arrows showing teamwork and convergence in PowerPoint and Google Slides design.
Charts & Diagrams
4 options

4-Step Converging Arrow Process

Visualize your 4-step process with converging arrows toward a single goal. Ideal for business strategy and project management.

Google Slides, PPTX

16:9

Older posts
Newer posts
← Previous Page1 Page2 Page3 Page4 … Page23 Next →
Search Templates by categories
Templates Charts & Diagrams Text & Tables Maps & Flags Timelines & Planning Graphics & Metaphors
Search Templates by colors
Support us
icon of a coffee cup for 'support us' - PresentationGo
... buying us a coffee

Love our templates? Show your support with a coffee!

Donate Here

Thank you for fueling our creativity!

Logotype PresentationGo
Content

Templates

Charts & Diagrams

Text & Tables

Graphics & Metaphors

Timelines & Planning

Maps

AI ImagesNEW

Best-Ofs & Tips

Legal

Terms and Conditions

Privacy Statement

Cookie Policy

Digital Millennium Copyright Act (DMCA) Policy

Disclaimer

Help

Contact us

FAQ

Templates

Charts & Diagrams

Text & Tables

Graphics & Metaphors

Timelines & Planning

Maps

Best-Ofs & Tips

Terms and Conditions

Privacy Statement

Cookie Policy

Digital Millennium Copyright Act (DMCA) Policy

Disclaimer

Contact us

FAQ

© Copyright 2026 Ofeex | PRESENTATIONGO® is a registered trademark | All rights reserved.

PresentationGO
Cookies & Privacy

To provide the best experiences, we and our partners use technologies like cookies to store and/or access device information. Consenting to these technologies will allow us and our partners to process personal data such as browsing behavior or unique IDs on this site and show (non-) personalized ads. Not consenting or withdrawing consent, may adversely affect certain features and functions.

Click below to consent to the above or make granular choices. Your choices will be applied to this site only. You can change your settings at any time, including withdrawing your consent, by using the toggles on the Cookie Policy, or by clicking on the manage consent button at the bottom of the screen.

Functional Always active
Needed for the website to work properly.
Preferences
Remember your settings (like language or display choices).
Statistics
The technical storage or access that is used exclusively for statistical purposes. Help us understand how the site is used so we can improve it (Google Analytics).
Marketing
Used to show relevant ads and measure ad performance (Google AdSense and partners).
Statistics

Marketing

Features
Always active

Always active
  • Manage options
  • Manage services
  • Manage {vendor_count} vendors
  • Read more about these purposes
Manage preferences
  • {title}
  • {title}
  • {title}
PresentationGO
Cookies & Privacy

We use cookies to run the site, measure traffic, and show ads that help keep our downloads free. Manage your choices anytime.

Functional Always active
Needed for the website to work properly.
Preferences
Remember your settings (like language or display choices).
Statistics
The technical storage or access that is used exclusively for statistical purposes. Help us understand how the site is used so we can improve it (Google Analytics).
Marketing
Used to show relevant ads and measure ad performance (Google AdSense and partners).
Statistics

Marketing

Features
Always active

Always active
  • Manage options
  • Manage services
  • Manage {vendor_count} vendors
  • Read more about these purposes
Manage preferences
  • {title}
  • {title}
  • {title}

Thank you for downloading from PresentationGO!

AI Images are free to use with no attribution required (though appreciated).

Presentation templates are also free, but require attribution.
For example, you can include this credit somewhere visible:

If you enjoy our free resources and want to support us, you can:

Buy us a coffee

Thank you for your continued support!