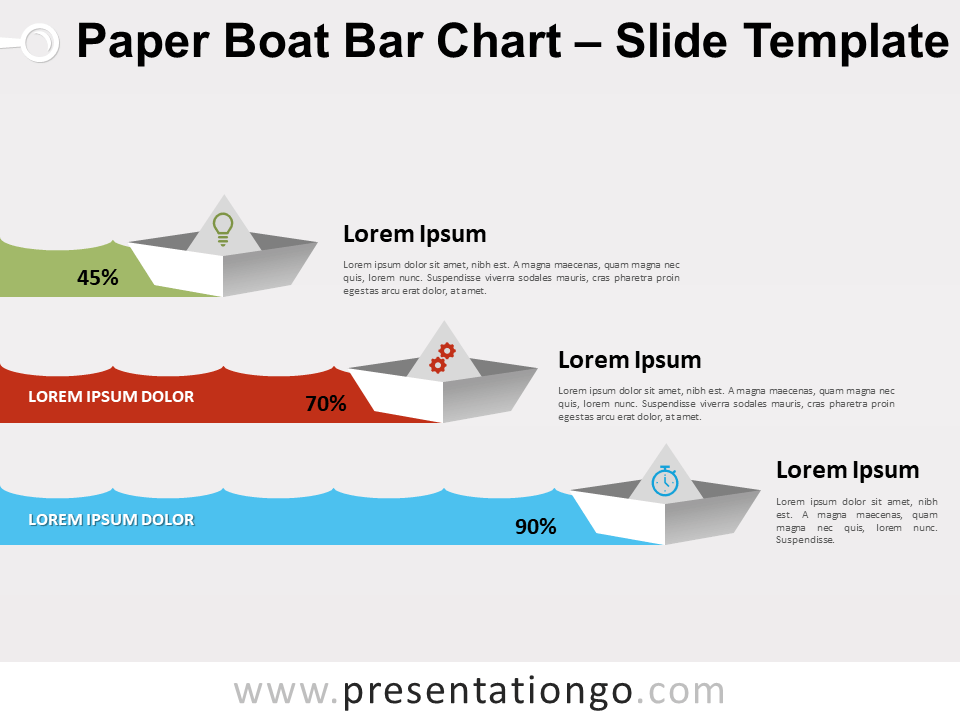
Free paper boat bar chart for PowerPoint and Google Slides. Origami boats with a colorful customizable horizontal wavy trail. Editable graphics with numbers, icons, and text placeholders.
Paper Boat Bar Chart
We are not all in the same boat! Indeed, these three little paper boats do not have the same progress in their journey. That’s why you can use this free Paper Boat Bar Chart slide template to compare three distinct data or the quantitative evolution of a single one. No doubt it will be the anchor of your next presentation!
This bar chart offers an origami version of boats to compare and analyze quantitative results. As a matter of fact, you can insert numbers or percentages inside the colorful wave design. You should also use the title and text placeholders to specify your results or ideas.
The boat race has started! Use this free Paper Boat Bar Chart template to show and compare numbers, statistics, frequencies, or measures. Be the captain of your own presentation and guide your audience where you want to go!
Shapes are 100% editable: colors and sizes can be easily changed.
Includes 2 slide option designs: Standard (4:3) and Widescreen (16:9).
Widescreen (16:9) size preview:
This ‘Paper Boat Bar Chart for PowerPoint and Google Slides’ features:
- 2 unique slides
- Light and Dark layout
- Ready to use template with numbers, icons, and text placeholders
- Completely editable shapes
- Uses a selection of editable PowerPoint icons
- Standard (4:3) and Widescreen (16:9) aspect ratios
- PPTX file and for Google Slides
Free fonts used:
- Helvetica (System Font)
- Calibri (System Font)


