Browse free Data visualization templates and AI images for PowerPoint and Google Slides — professionally designed, ready to customize, no sign-up required.
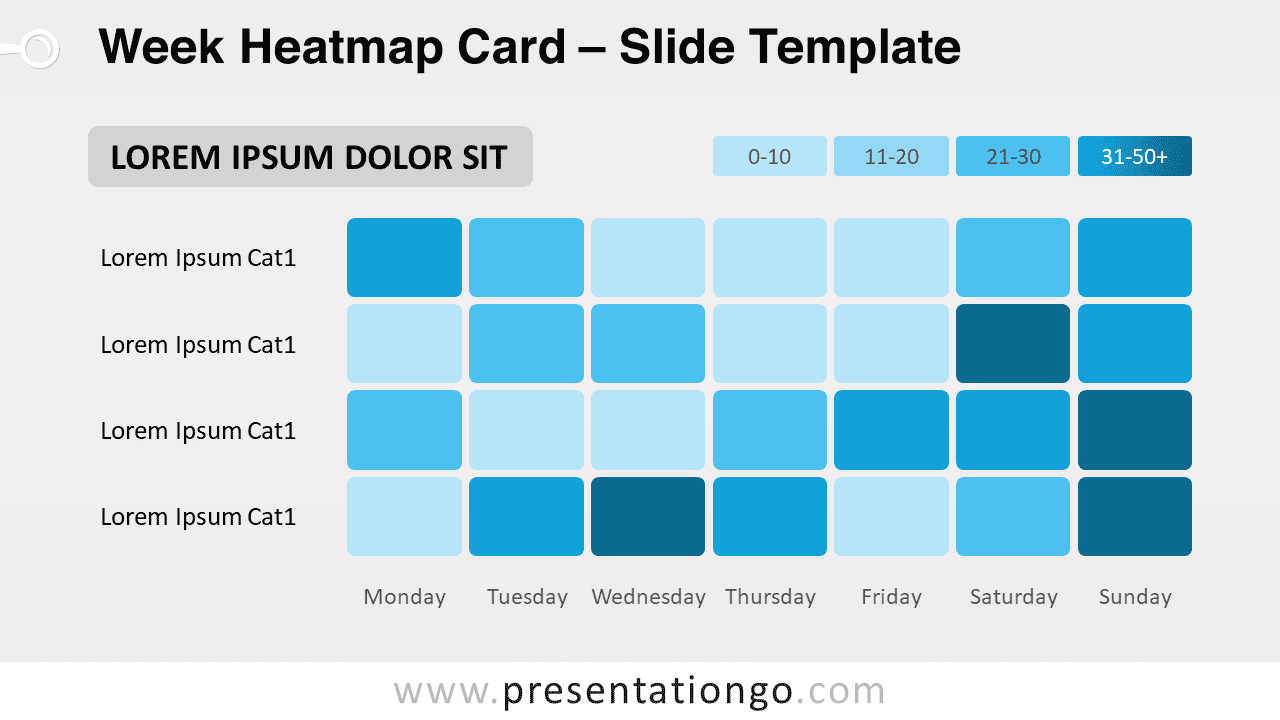
Free week heatmap card for PowerPoint and Google Slides. A visual map of the relationship between different categories and the days of the week. Editable ...
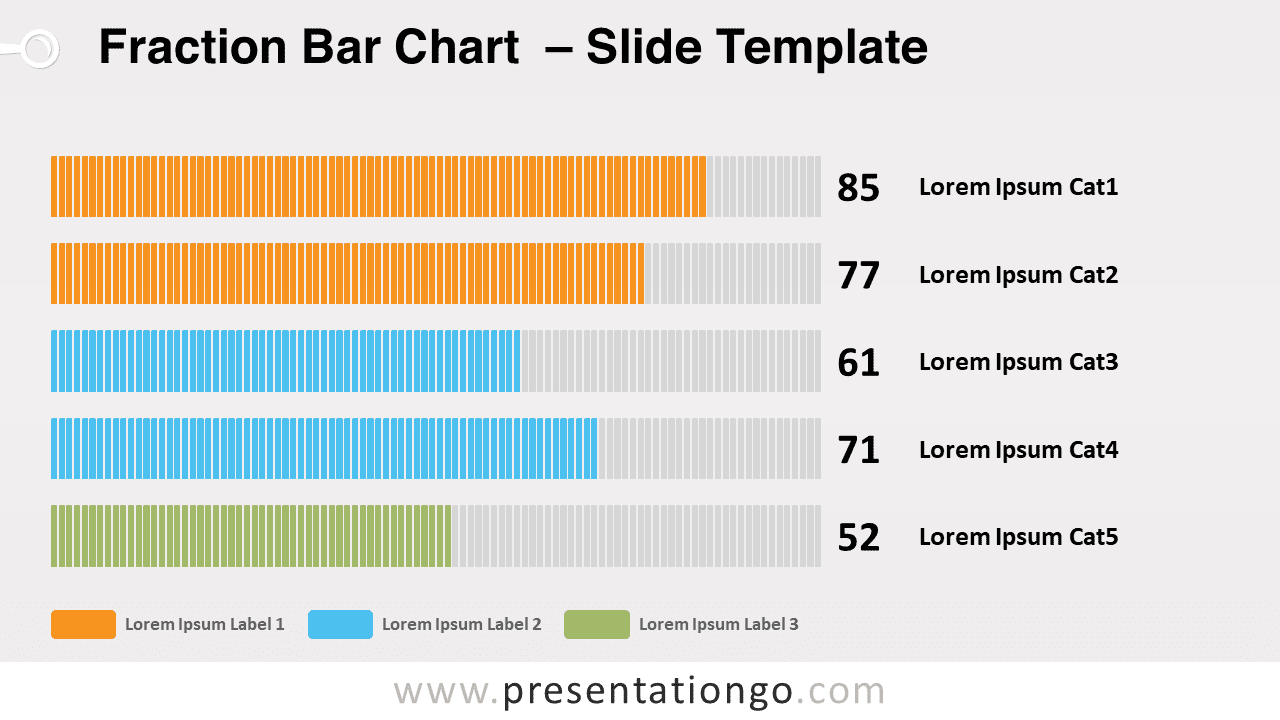
Free fraction bar chart for PowerPoint and Google Slides. A non-data-driven chart made of 100 brick-style bars. Editable graphics with number (percentage) and text placeholders.
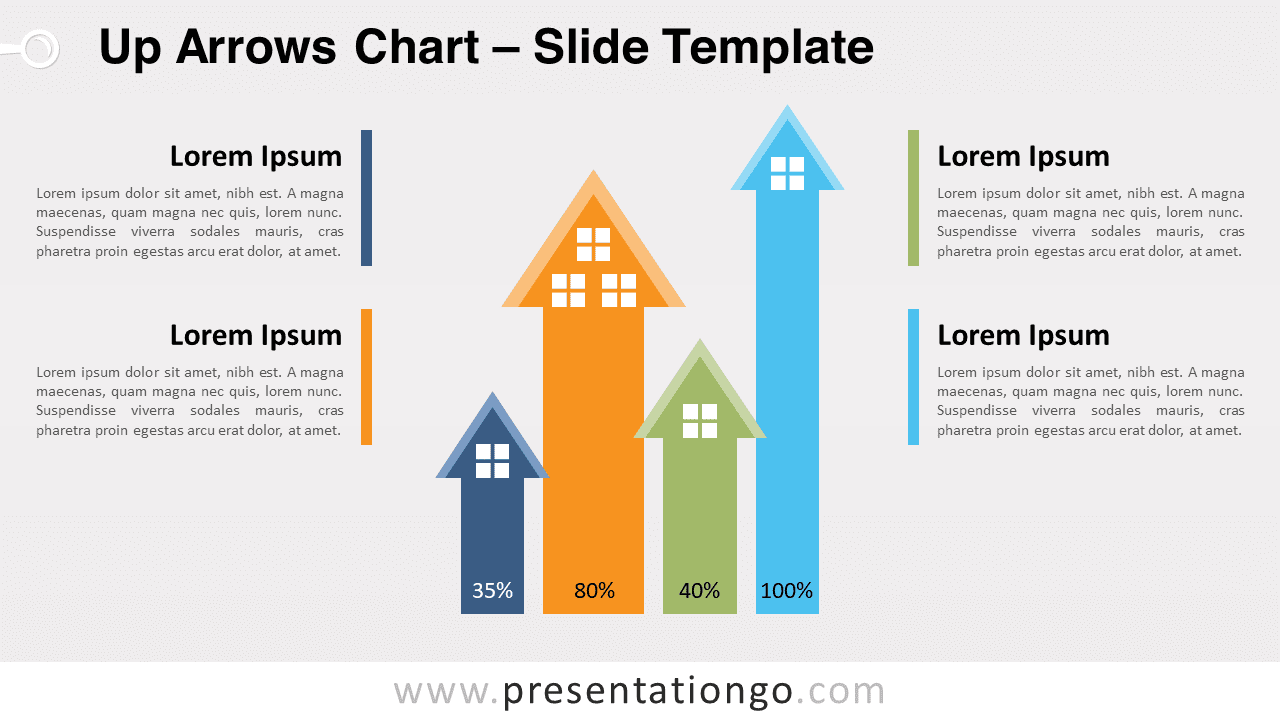
Free up-arrows chart for PowerPoint and Google Slides. Replace your data-driven column charts with easy-to-adjust up-arrows. Editable graphics with percentage percentages, icons, and text placeholders.
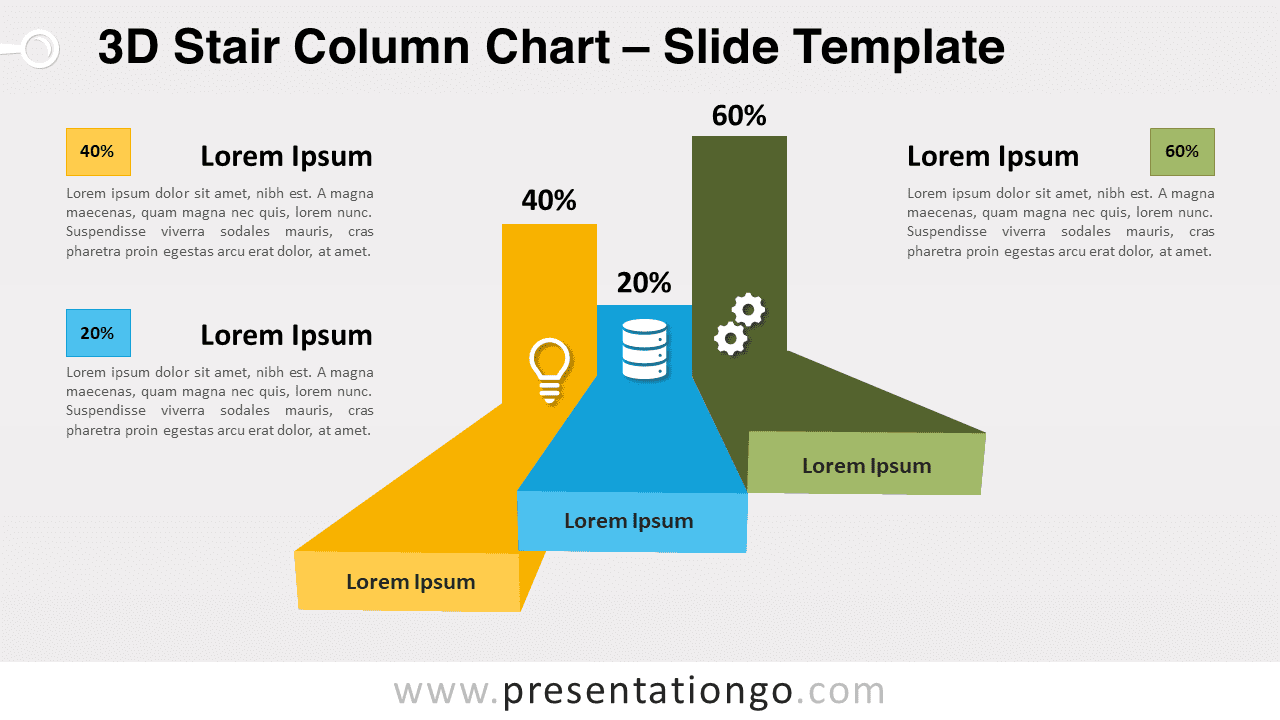
Free 3D stair column chart for PowerPoint and Google Slides. A beautiful data visualization option to showcase 3 categories. Editable graphics with icons, and text ...
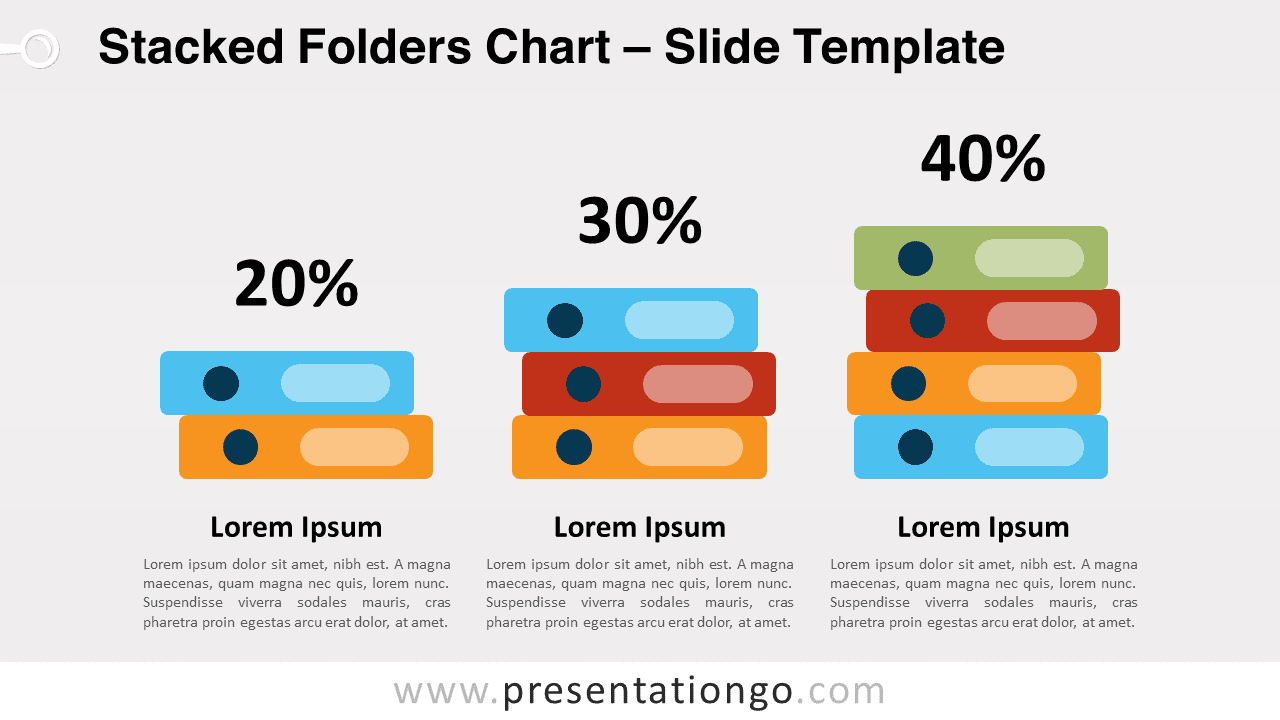
Free stacked folders chart for PowerPoint and Google Slides. Stacked folders or books to show quantitative results. Editable graphics with percentage and text placeholders.
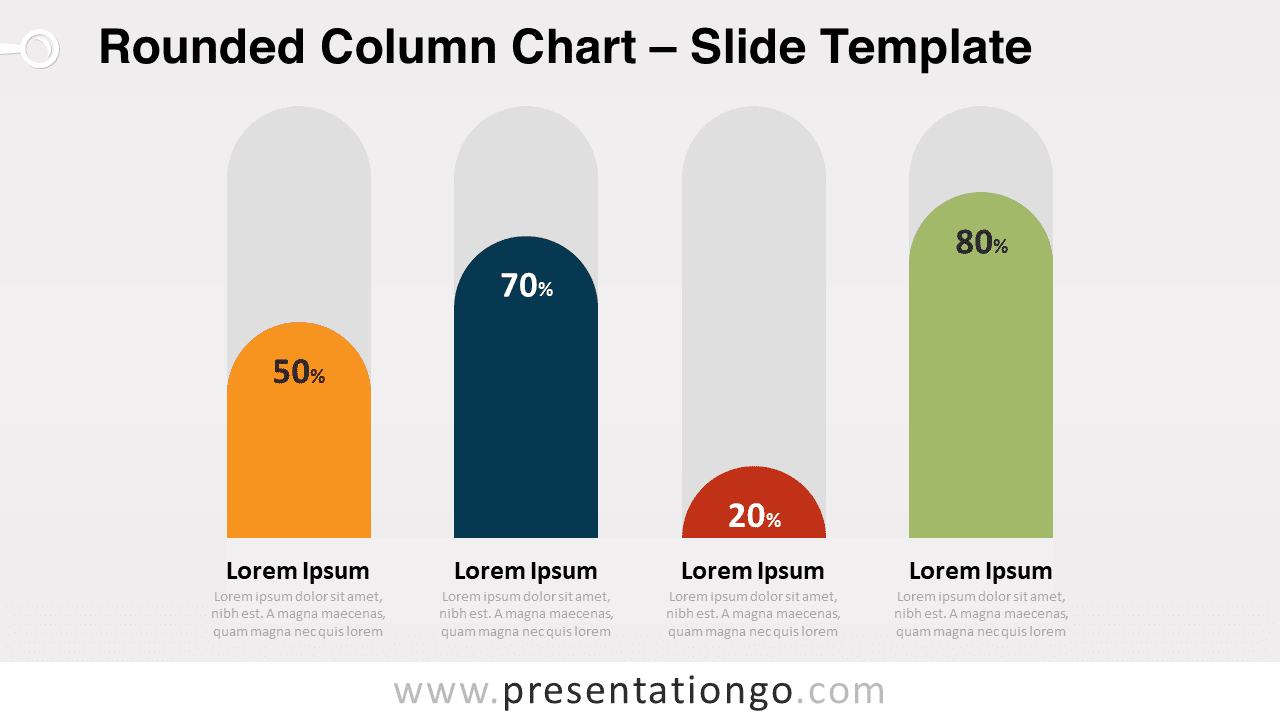
Free rounded column chart for PowerPoint and Google Slides. A non-data-driven chart alternative to the regular column chart design. Editable graphics with percentage and text ...
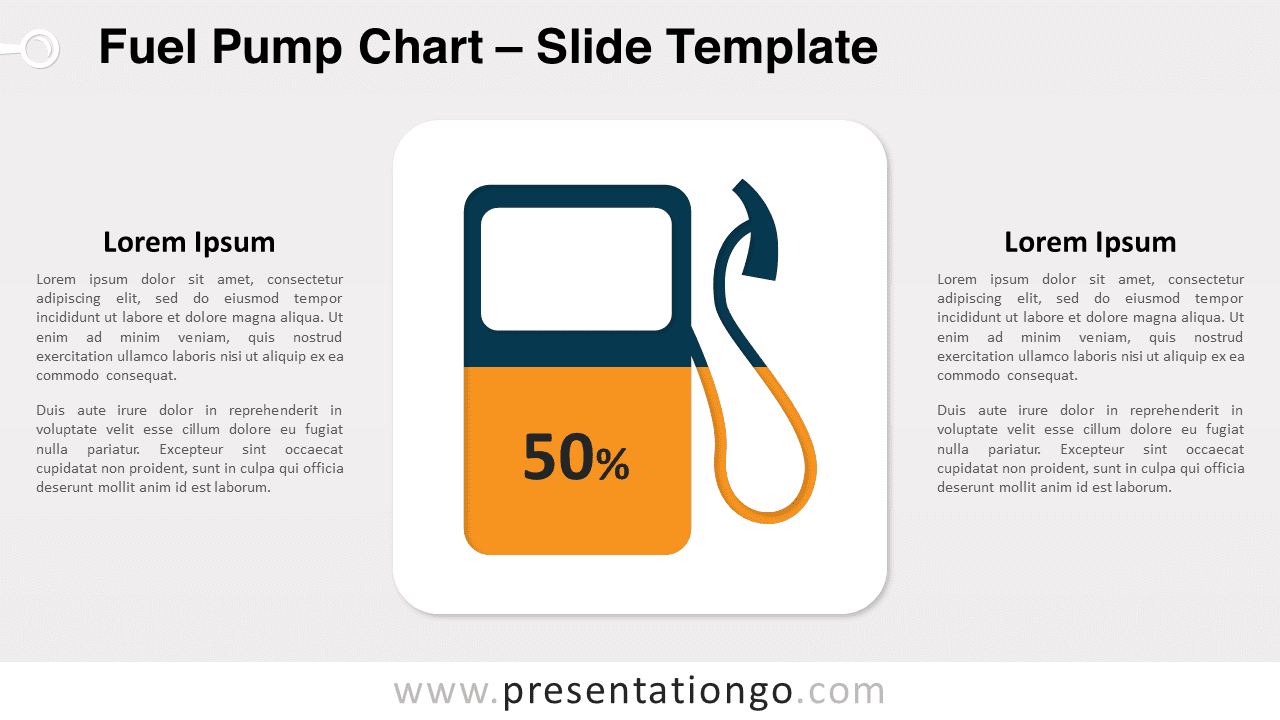
Free fuel pump chart for PowerPoint and Google Slides. Showcase and compare quantitative results about oil and gas topics. Editable graphics with percentage and text ...
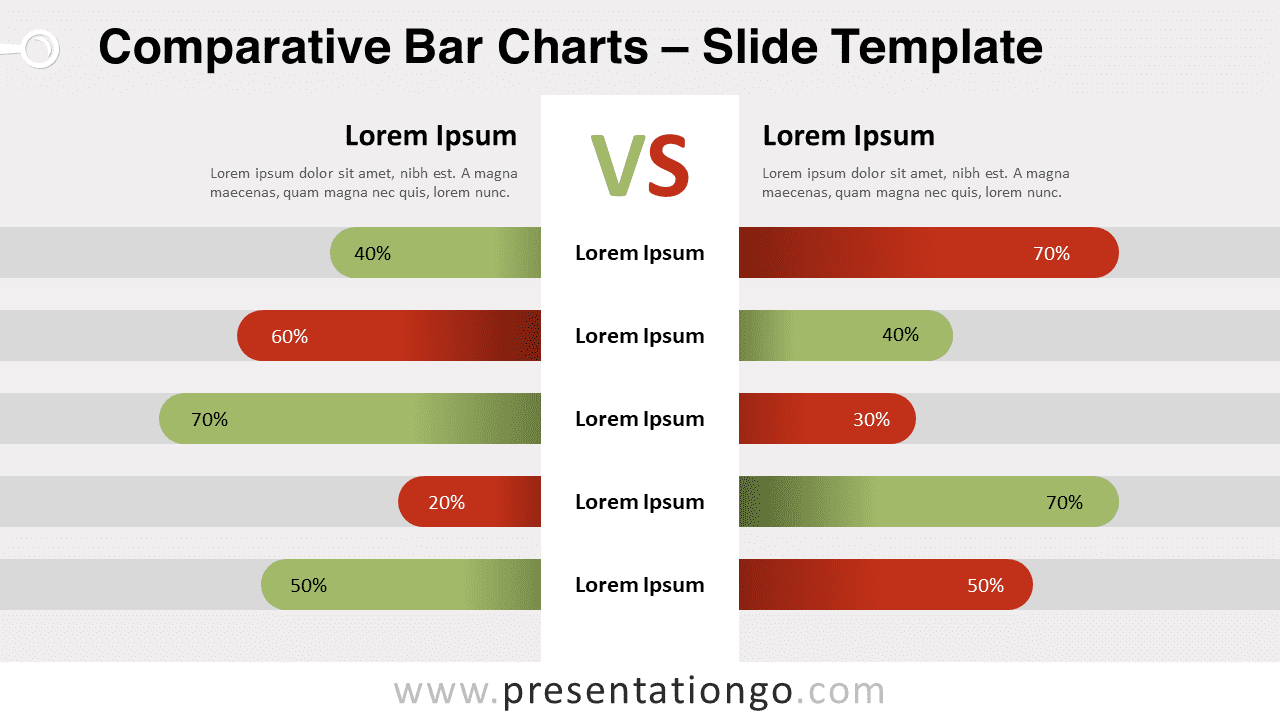
Free comparative bar charts for PowerPoint and Google Slides. A simple and easy-to-read option to share and compare quantitative results. Editable graphics with text placeholders.
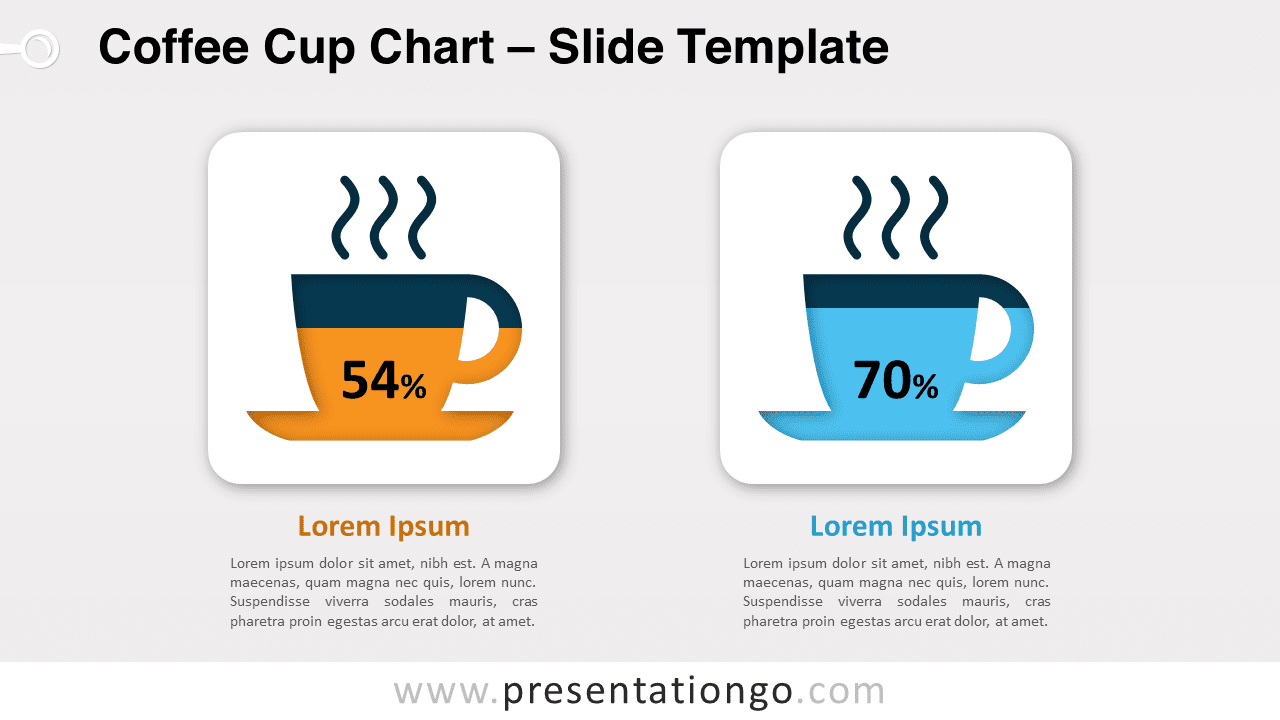
Free coffee cup Chart for PowerPoint and Google Slides. An original infographic option to share and compare quantitative results. Editable graphics with text placeholders.
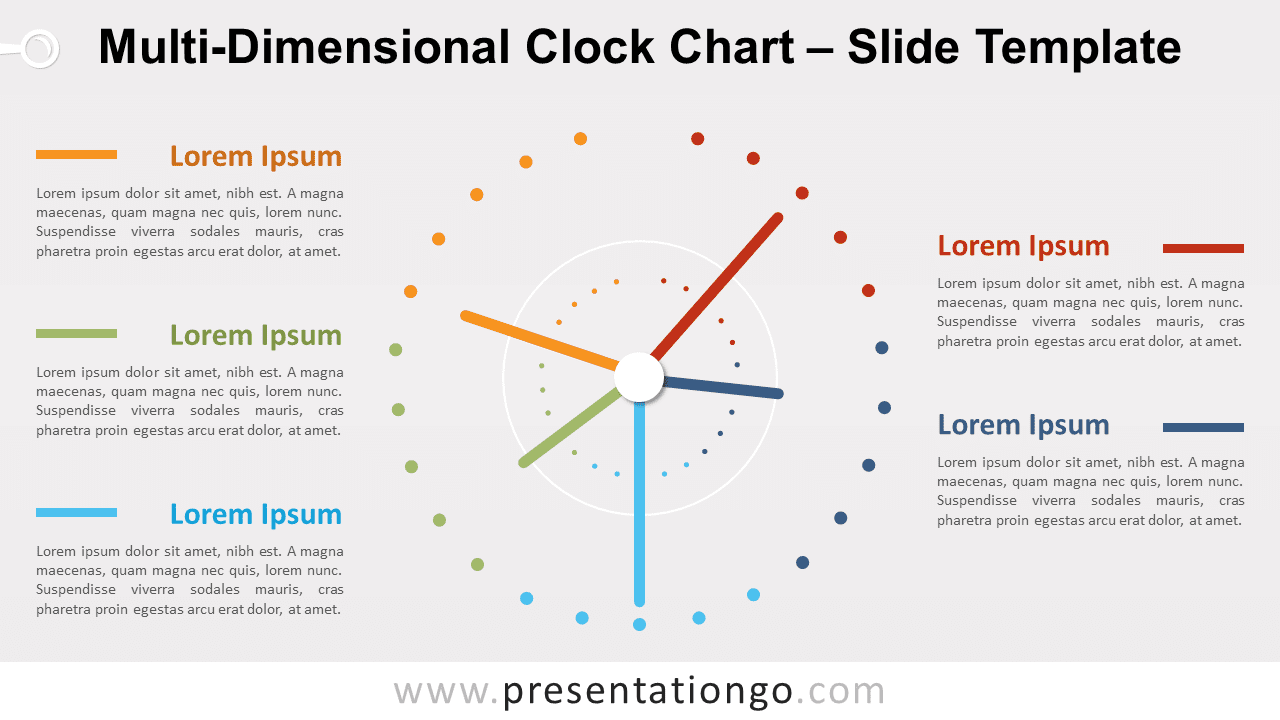
Free multi-dimensional clock chart for PowerPoint and Google Slides. An original data visualization graphic to showcase multivariate data. Editable graphics with text placeholders.
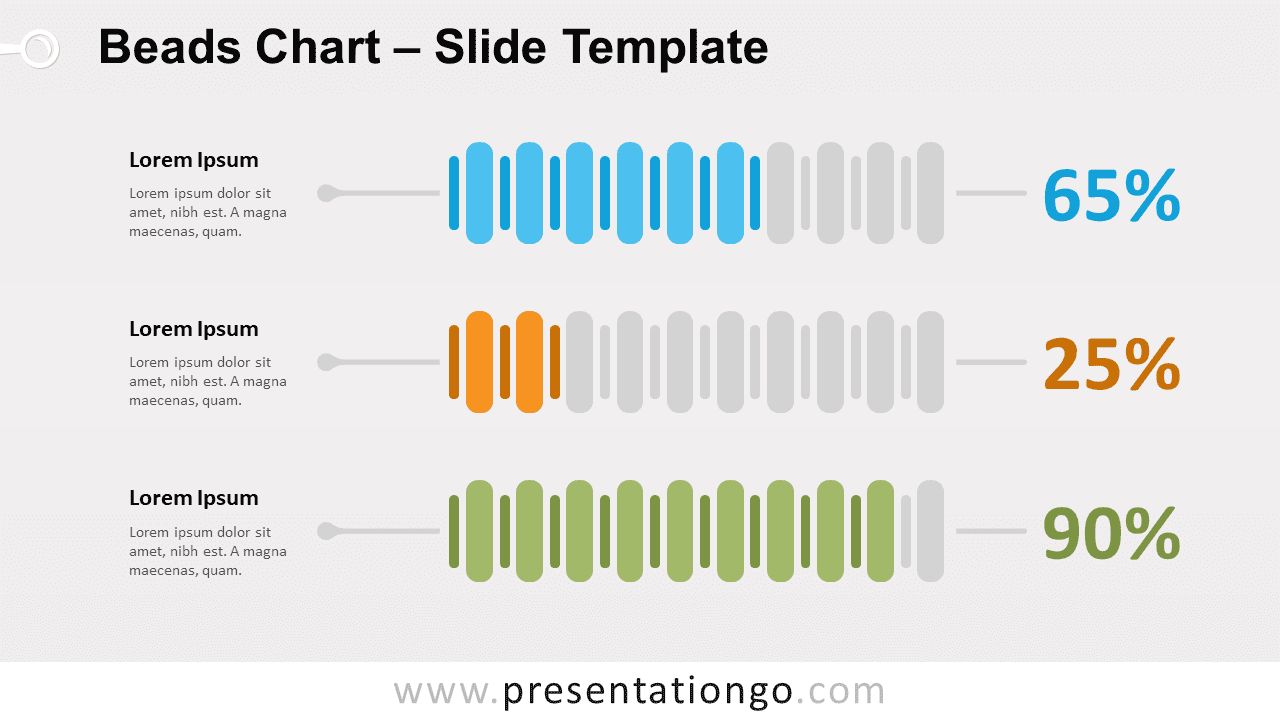
Free beads chart for PowerPoint and Google Slides. Horizontal rows of beads of different colors to display and compare custom numbers or percentages. Editable graphics ...
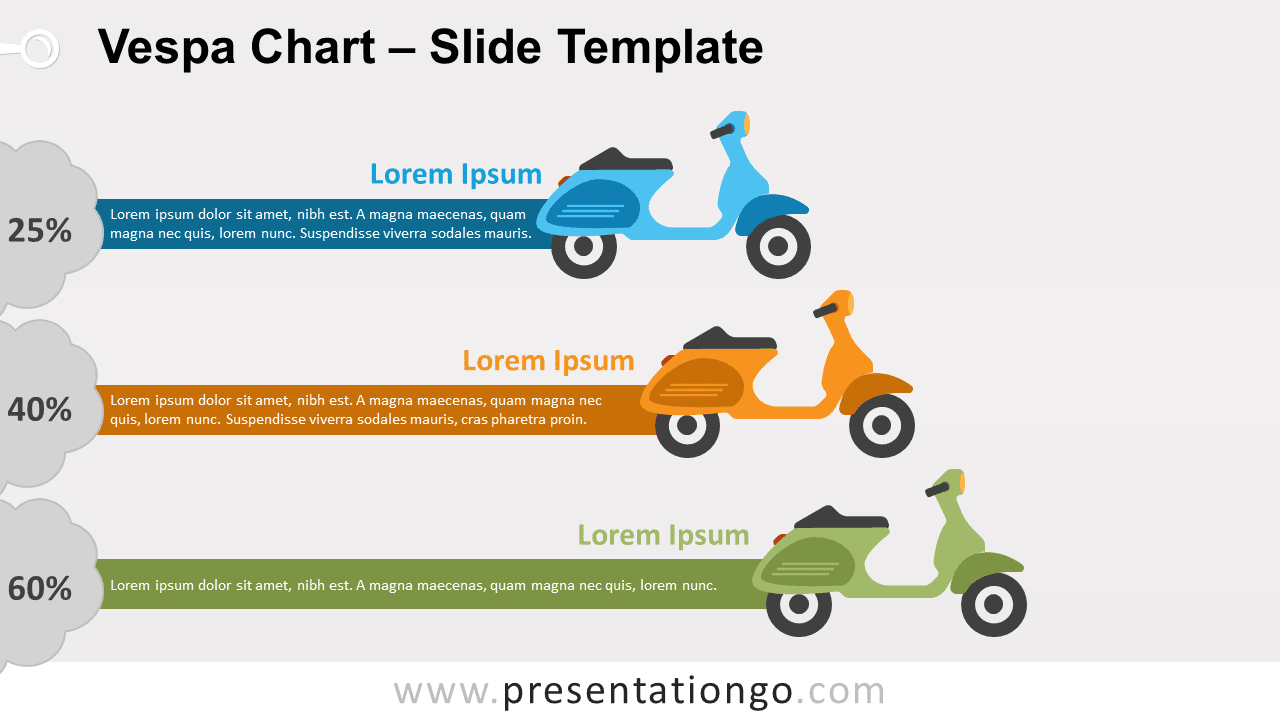
Free Vespa chart for PowerPoint and Google Slides. A fun non-data-driven alternative using Italian motorcycles to present relative numbers or to compare concepts. Editable graphics ...
Google SlidesPPTX
4:3,16:9
Showing 92–104 of 148 resources
Cookies & Privacy
To provide the best experiences, we and our partners use technologies like cookies to store and/or access device information. Consenting to these technologies will allow us and our partners to process personal data such as browsing behavior or unique IDs on this site and show (non-) personalized ads. Not consenting or withdrawing consent, may adversely affect certain features and functions.
Click below to consent to the above or make granular choices. Your choices will be applied to this site only. You can change your settings at any time, including withdrawing your consent, by using the toggles on the Cookie Policy, or by clicking on the manage consent button at the bottom of the screen.
Functional
Always active
Needed for the website to work properly.
Preferences
Remember your settings (like language or display choices).
Statistics
The technical storage or access that is used exclusively for statistical purposes.Help us understand how the site is used so we can improve it (Google Analytics).
Marketing
Used to show relevant ads and measure ad performance (Google AdSense and partners).
We use cookies to run the site, measure traffic, and show ads that help keep our downloads free. Manage your choices anytime.
Functional
Always active
Needed for the website to work properly.
Preferences
Remember your settings (like language or display choices).
Statistics
The technical storage or access that is used exclusively for statistical purposes.Help us understand how the site is used so we can improve it (Google Analytics).
Marketing
Used to show relevant ads and measure ad performance (Google AdSense and partners).