Skip to content
PresentationGO
  • Explore
    • Templates
      • Abstract
      • Sports
      • Business
      • Religion & Holidays
      • Nature
      • Technology
      • Professions
      • Flat Lays & Scenes
      • Health & Recreation
      • Color Palettes
      • Education
      • Food & Drink
      • Science
      • CertificatesNEW
      • All Templates
    • Charts & Diagrams
      • Processes
        • Circular
        • Linear
        • Alternating
        • Stairs
        • Bending
      • Funnels
      • Pyramids
      • Matrix Charts
      • Business Models
      • Non-Data-Driven Chart Alternatives
      • Radial Diagrams
      • Flow Charts
      • Data-Driven Charts & Graphs
      • Organizational Charts
      • Clusters & Relationships
      • Venn Diagrams
      • All Charts & Diagrams
    • Text & Tables
      • Text Boxes
      • Comparisons
      • Paper & Banners
      • Numbered Lists
      • Speaking Bubbles
      • Pricing Tables
      • Bullet Point / Text Layouts
      • Contents & Table of Contents
      • Quotes
      • Word Clouds
      • To-do & Checklists
      • All Text & Tables
    • Timelines & Planning
      • Calendars
      • Timelines
      • Gantt Charts
      • Agenda
      • All Timelines & Planning
    • Graphics & Metaphors
      • Concepts
      • Silhouettes & People
      • Light Bulbs
      • Trees
      • Letters & Numbers
      • Signs
      • Mockups
      • Food
      • Money
      • Road
      • Target and Goals
      • All Graphics & Metaphors
    • Maps & Flags
      • Flag Templates
      • Continent Maps
      • Country Maps
        • Africa
        • Asia
        • Australia / Oceania
        • Europe
        • North America
        • South America
      • World Maps
      • All Maps
    • AI ImagesNEW
  • Search by
    • Colors
      • Black
      • Blue
      • Brown
      • Gray
      • Green
      • Cream
      • Light Blue
      • Orange
      • Pink
      • Purple
      • Gold
      • Red
      • White
      • Yellow
      • Teal
    • Steps (Options)
      • 2 options
      • 3 options
      • 4 options
      • 5 options
      • 6 options
      • 7 options
      • 8 options
      • 9 options
      • 10 options
      • 12 options
  • Templates
  • Charts & Diagrams
  • Text & Tables
  • Timelines & Planning
  • Graphics & Metaphors
  • Maps & Flags
  • AI ImagesNEW

Infographics

Discover our range of free, editable infographics for PowerPoint and Google Slides. Our collection offers a variety of charts, diagrams, graphics, and maps, each designed to make your presentations visually compelling and informative. Easily customizable to suit your specific needs, these templates are perfect for business, academic, or personal use. Elevate your presentations with our user-friendly infographics that are crafted to enhance data visualization and audience engagement.

Refine Your Search

Free Eight Loop Diagram PowerPoint template with four numbered loops on a white background, including text boxes and icons for Google Slides.
Charts & Diagrams
4 options

Eight Loop Diagram

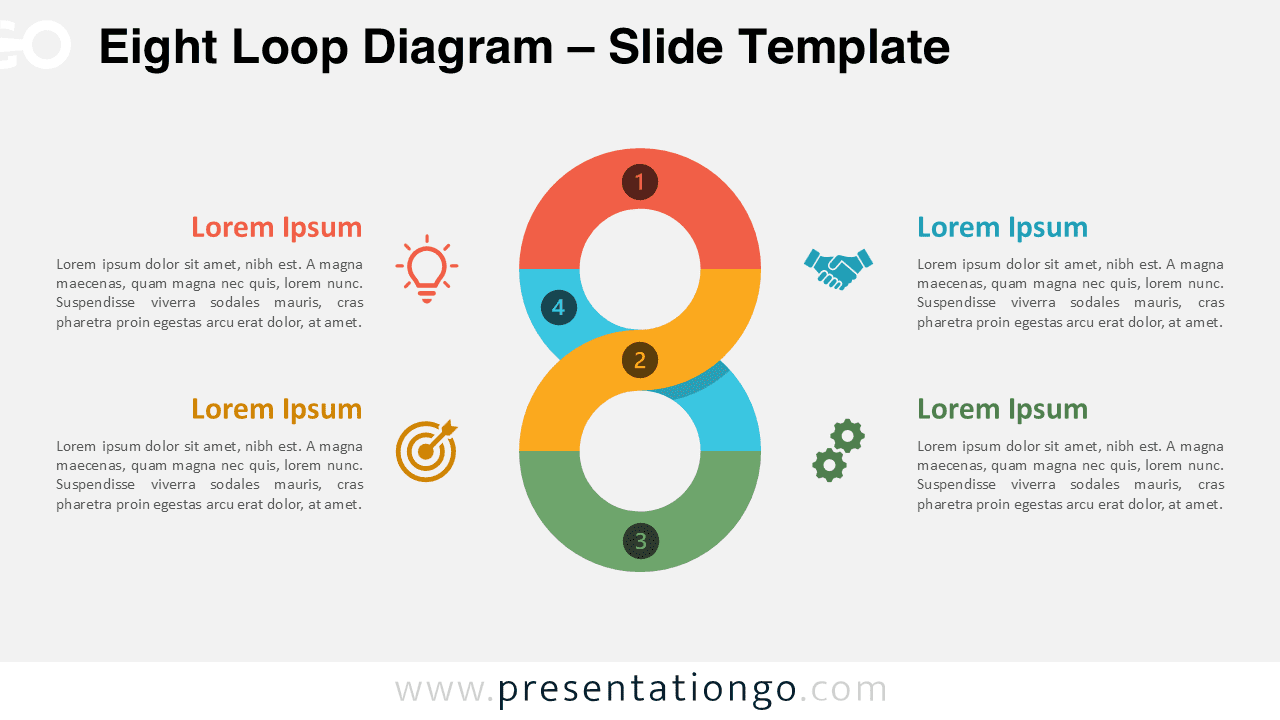
Use this symmetrical eight-loop diagram to depict four connected steps in a recurring workflow or strategic cycle.

Google Slides, PPTX

4:316:9

Free Four-Link Clover Loop PowerPoint template and Google Slides diagram featuring four interlocking rounded shapes on a white background, with clear labels and circular icons in each section.
Charts & Diagrams
4 options

Four-Link Clover Loop

A four-part loop diagram ideal for visualizing interconnected concepts, workflows, or cyclical systems in your presentations.

Google Slides, PPTX

4:316:9

Widescreen rocket growth path diagram showing a 4-step launch trajectory with a light background for PowerPoint and Google Slides.
Charts & DiagramsGraphics & Metaphors
4 options

Rocket Growth Path

Use this rocket-inspired diagram to showcase growth stages, planning phases, or milestone achievements in four segments.

Google Slides, PPTX

4:316:9

Five-part gear diagram with a light background, editable icons, and alternating text layout for PowerPoint and Google Slides.
Charts & Diagrams
5 options

Gear Process Diagram

Visualize five connected steps using a gear-based layout ideal for workflows, timelines, or business process presentations.

Google Slides, PPTX

4:316:9

A widescreen version of the Smartphone Trio template with a light background, designed to display app stats, metrics, or tech comparisons.
Graphics & Metaphors
3 options

Smartphone Trio

Compare three key metrics or categories using editable smartphone mockups in this clean, mobile-inspired layout for presentations.

Google Slides, PPTX

4:316:9

Light background version of the demographic waffle chart template for PowerPoint and Google Slides with editable male/female grids.
Charts & Diagrams

Demographic Waffle Chart

A clear and customizable waffle chart to compare male and female data with 100-icon grids for precise visual communication.

Google Slides, PPTX

4:316:9

Light background version of the Emotion Waffle Chart for PowerPoint and Google Slides with editable sentiment-based face icons.
Charts & Diagrams

Emotion Waffle Chart

Visualize sentiment feedback using 100 expressive face icons in a clear, editable waffle chart format.

Google Slides, PPTX

4:316:9

Four-Panel Waffle Charts template in widescreen format with a light background, designed for PowerPoint and Google Slides.
Charts & Diagrams
4 options

Four-Panel Waffle Charts

Designed for clarity and comparison, this template displays four data visuals using 10×10 waffle grids with editable text and colors.

Google Slides, PPTX

4:316:9

Widescreen version of three-panel waffle charts with light background, designed for PowerPoint and Google Slides presentations.
Charts & Diagrams
3 options

Three-Panel Waffle Charts

Show segmented statistics clearly using three customizable waffle charts in one aligned layout for easy analysis.

Google Slides, PPTX

4:316:9

Editable waffle chart slide with a light background for PowerPoint and Google Slides, showing side-by-side percentage comparison grids.
Charts & Diagrams
2 options

Two-Panel Waffle Charts

A simple yet powerful way to show two distinct metrics side by side using visual grids.

Google Slides, PPTX

4:316:9

Editable six-level pyramid template for PowerPoint and Google Slides with a light background and labeled text boxes on each side.
Charts & Diagrams
6 options

Six-Level Tiered Pyramid

Display step-by-step workflows or layered information with this clean six-part pyramid diagram, ready for PowerPoint and Google Slides.

Google Slides, PPTX

4:316:9

Widescreen five-level pyramid for PowerPoint and Google Slides with a light background, color-coded tiers, and linked text sections.
Charts & Diagrams
5 options

Five-Level Tiered Pyramid

Use this five-tiered pyramid to present hierarchical levels, strategic stages, or growth models with clear alignment and visual balance.

Google Slides, PPTX

4:316:9

Older posts
Newer posts
← Previous Page1 … Page9 Page10 Page11 … Page60 Next →
Search Templates by categories
Templates Charts & Diagrams Text & Tables Maps & Flags Timelines & Planning Graphics & Metaphors
Search Templates by colors
Support us
icon of a coffee cup for 'support us' - PresentationGo
... buying us a coffee

Love our templates? Show your support with a coffee!

Donate Here

Thank you for fueling our creativity!

Logotype PresentationGo
Content

Templates

Charts & Diagrams

Text & Tables

Graphics & Metaphors

Timelines & Planning

Maps

AI ImagesNEW

Best-Ofs & Tips

Legal

Terms and Conditions

Privacy Statement

Cookie Policy

Digital Millennium Copyright Act (DMCA) Policy

Disclaimer

Help

Contact us

FAQ

Templates

Charts & Diagrams

Text & Tables

Graphics & Metaphors

Timelines & Planning

Maps

Best-Ofs & Tips

Terms and Conditions

Privacy Statement

Cookie Policy

Digital Millennium Copyright Act (DMCA) Policy

Disclaimer

Contact us

FAQ

© Copyright 2026 Ofeex | PRESENTATIONGO® is a registered trademark | All rights reserved.

PresentationGO
Cookies & Privacy

To provide the best experiences, we and our partners use technologies like cookies to store and/or access device information. Consenting to these technologies will allow us and our partners to process personal data such as browsing behavior or unique IDs on this site and show (non-) personalized ads. Not consenting or withdrawing consent, may adversely affect certain features and functions.

Click below to consent to the above or make granular choices. Your choices will be applied to this site only. You can change your settings at any time, including withdrawing your consent, by using the toggles on the Cookie Policy, or by clicking on the manage consent button at the bottom of the screen.

Functional Always active
Needed for the website to work properly.
Preferences
Remember your settings (like language or display choices).
Statistics
The technical storage or access that is used exclusively for statistical purposes. Help us understand how the site is used so we can improve it (Google Analytics).
Marketing
Used to show relevant ads and measure ad performance (Google AdSense and partners).
Statistics

Marketing

Features
Always active

Always active
  • Manage options
  • Manage services
  • Manage {vendor_count} vendors
  • Read more about these purposes
Manage preferences
  • {title}
  • {title}
  • {title}
PresentationGO
Cookies & Privacy

We use cookies to run the site, measure traffic, and show ads that help keep our downloads free. Manage your choices anytime.

Functional Always active
Needed for the website to work properly.
Preferences
Remember your settings (like language or display choices).
Statistics
The technical storage or access that is used exclusively for statistical purposes. Help us understand how the site is used so we can improve it (Google Analytics).
Marketing
Used to show relevant ads and measure ad performance (Google AdSense and partners).
Statistics

Marketing

Features
Always active

Always active
  • Manage options
  • Manage services
  • Manage {vendor_count} vendors
  • Read more about these purposes
Manage preferences
  • {title}
  • {title}
  • {title}

Thank you for downloading from PresentationGO!

AI Images are free to use with no attribution required (though appreciated).

Presentation templates are also free, but require attribution.
For example, you can include this credit somewhere visible:

If you enjoy our free resources and want to support us, you can:

Buy us a coffee

Thank you for your continued support!