Latest Templates
Discover our vast, continually growing collection of free, high-quality, customizable templates & Infographics for PowerPoint and Google Slides presentations, designed to enhance your visual communication.

Semi-Donut Chart with 7 Parts for PowerPoint and Google Slides
Circular half donut chart (also known as doughnut chart) with 7 equal parts.
Google Slides, PPTX
4:316:9

Semi-Donut Chart with 6 Parts for PowerPoint and Google Slides
Circular half donut chart (also known as doughnut chart) with 6 equal parts.
Google Slides, PPTX
4:316:9
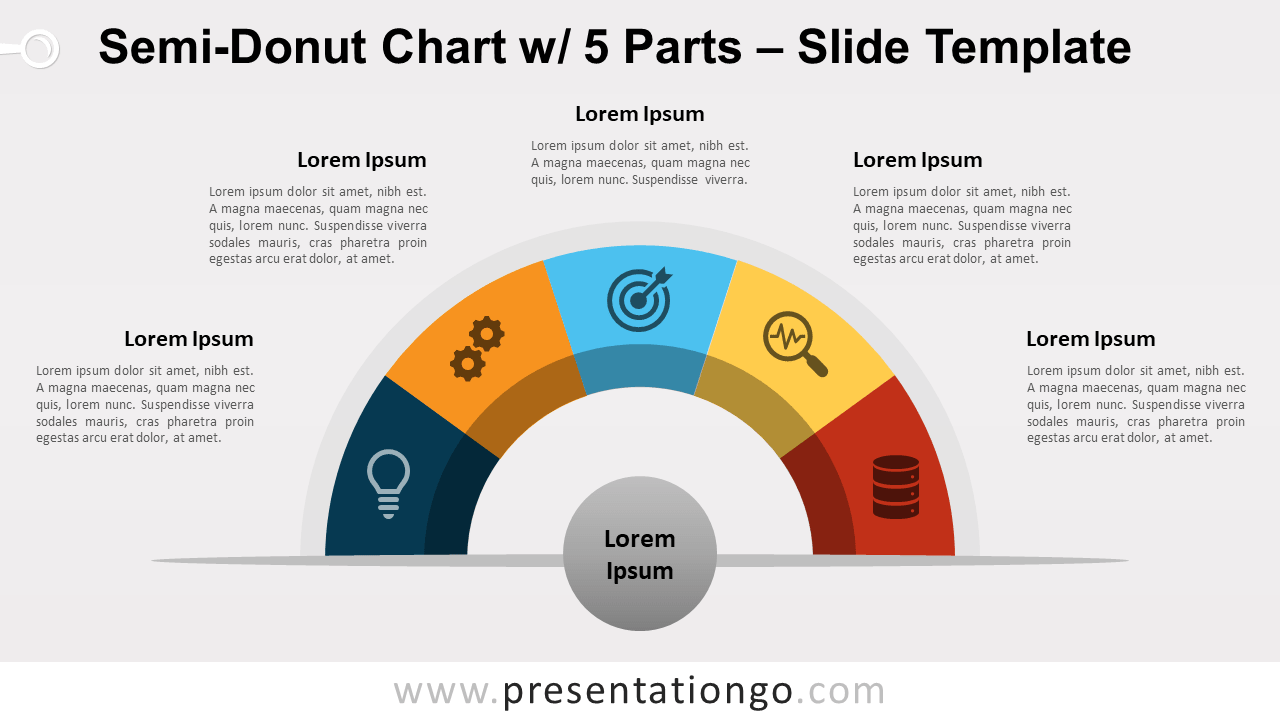
Semi-Donut Chart with 5 Parts for PowerPoint and Google Slides
Circular half donut chart (also known as doughnut chart) with 5 equal parts.
Google Slides, PPTX
4:316:9

Semi-Donut Chart with 4 Parts for PowerPoint and Google Slides
Circular half donut chart (also known as doughnut chart) with 4 equal parts.
Google Slides, PPTX
4:316:9
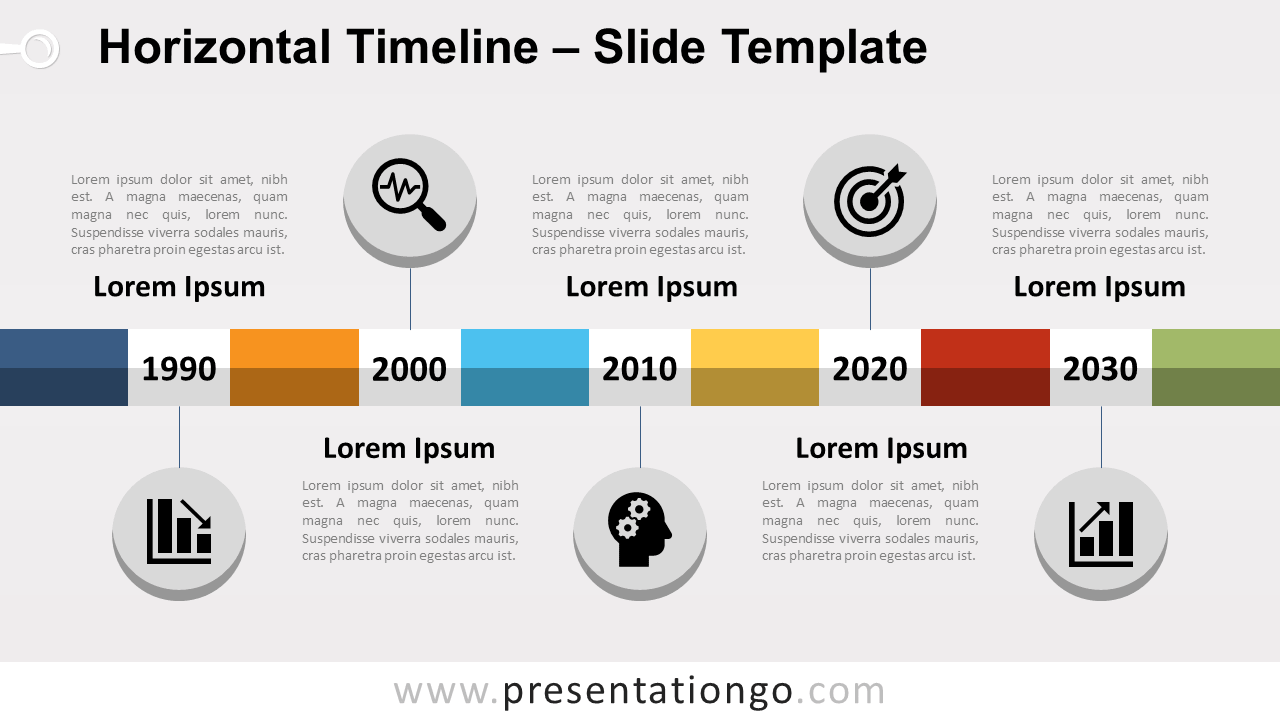
Horizontal Timeline for PowerPoint and Google Slides
Multicolored infographic timeline banner with circles and icons.
Google Slides, PPTX
4:316:9

Flat Design Text Boxes for PowerPoint and Google Slides
Alternating set of title and content text boxes in a flat design style.
Google Slides, PPTX
4:316:9

Banners with Sleeves for PowerPoint and Google Slides
3 colorful horizontal banners (different lengths) with gray sleeves.
Google Slides, PPTX
4:316:9

Modern Cycle List for PowerPoint and Google Slides
Circular diagram with 6 infographic stadium banners.
Google Slides, PPTX
4:316:9
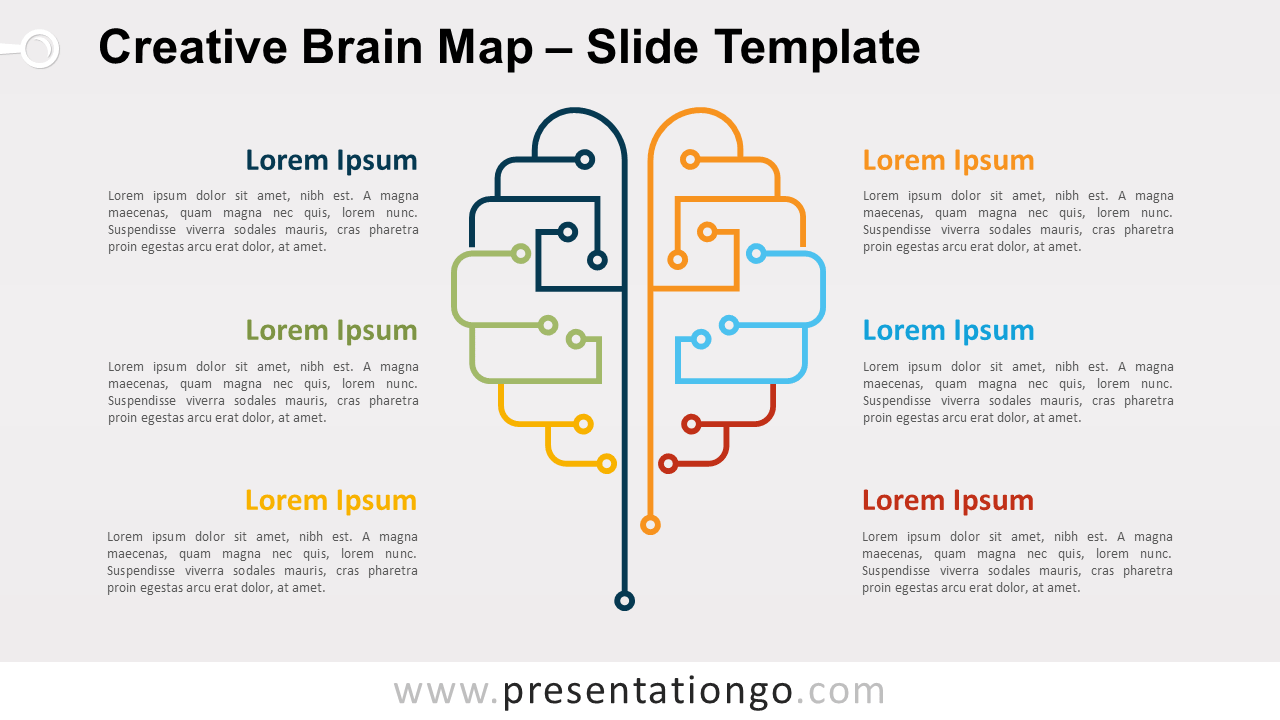
Creative Brain Map for PowerPoint and Google Slides
Infographic schematic diagram of a brain designed with colorful lines (like routes).
Google Slides, PPTX
4:316:9
3D Curved Arrow Process for PowerPoint and Google Slides
6-step horizontal process diagram right arrow.
Google Slides, PPTX
4:316:9

Sphere Matrix for PowerPoint and Google Slides
Colorful 3D sphere, with 4 parts (2×2 cells) and icons.
Google Slides, PPTX
4:316:9

Serpentine Process Diagram for PowerPoint and Google Slides
6-step alternating horizontal process diagram with canes and curved shapes.
Google Slides, PPTX
4:316:9
