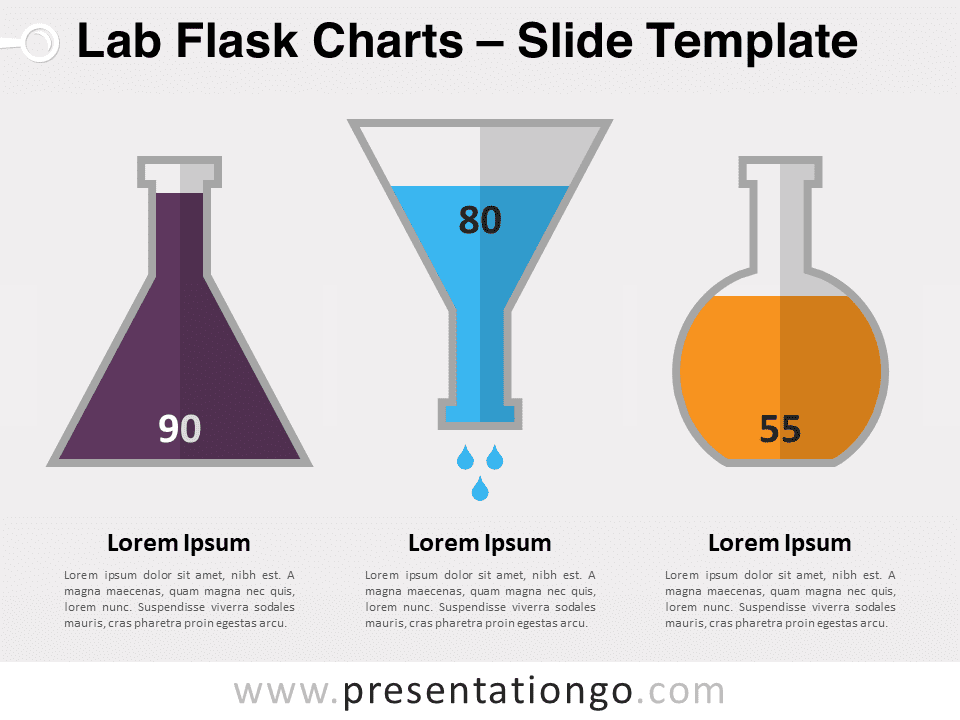
Enhance science presentations with data visualization using Lab Flask Charts for PowerPoint and Google Slides. Dynamic, editable graphics.
Google Slides, PPTX
4:316:9
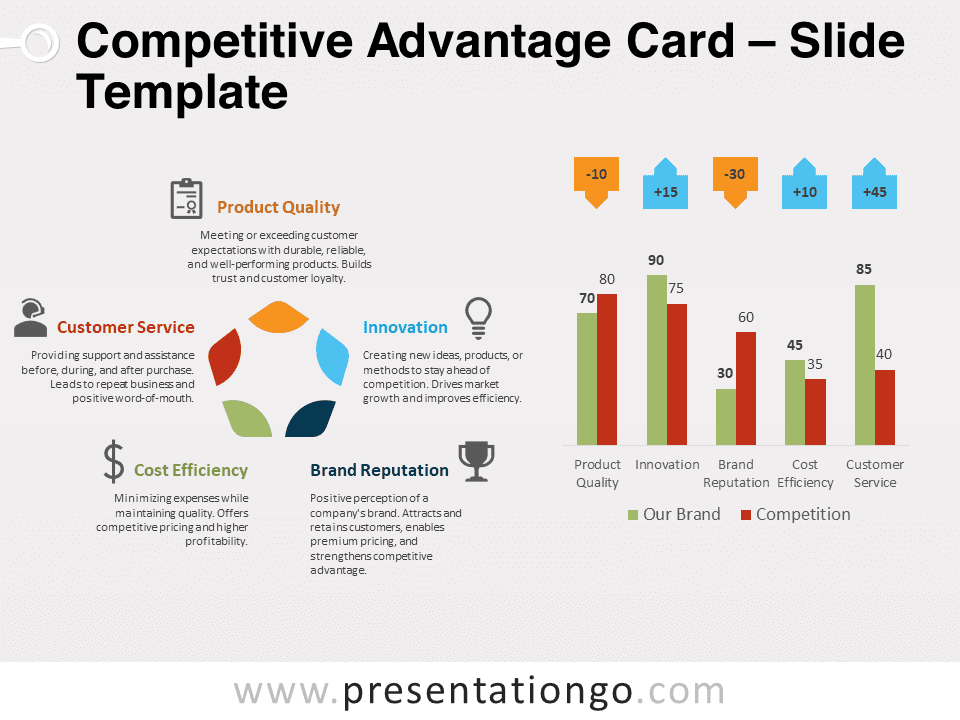
Browse our extensive selection of 18 Column Charts, expertly designed to enhance your PowerPoint and Google Slides presentations. These visually appealing, data-driven charts allow you to convey your information in an organized and easily digestible manner, ensuring your audience remains engaged and informed.
Column charts are perfect for presenting data comparisons across categories, illustrating trends over time, or highlighting differences between groups. They can be utilized in a variety of scenarios, including financial reporting, market analysis, performance measurement, and demographic studies. In your presentation slides, column charts add depth and clarity to your data, reinforcing your key points and strengthening your argument.
Our Column Chart collection offers an array of designs, layouts, and color schemes to match your specific needs. Customize these adaptable templates to align with your brand identity and presentation theme, creating a professional and consistent appearance.
Elevate your PowerPoint and Google Slides presentations with these meticulously crafted charts, and let your data take center stage.
Google Slides, PPTX
4:316:9
Google Slides, PPTX
4:316:9

PPTX
4:316:9

Google Slides, PPTX
4:316:9

Google Slides, PPTX
4:316:9
Google Slides, PPTX
4:316:9

PPTX
4:316:9

PPTX
4:316:9
PPTX
4:316:9

Google Slides, PPTX
4:316:9

PPTX
4:316:9

PPTX
4:316:9
