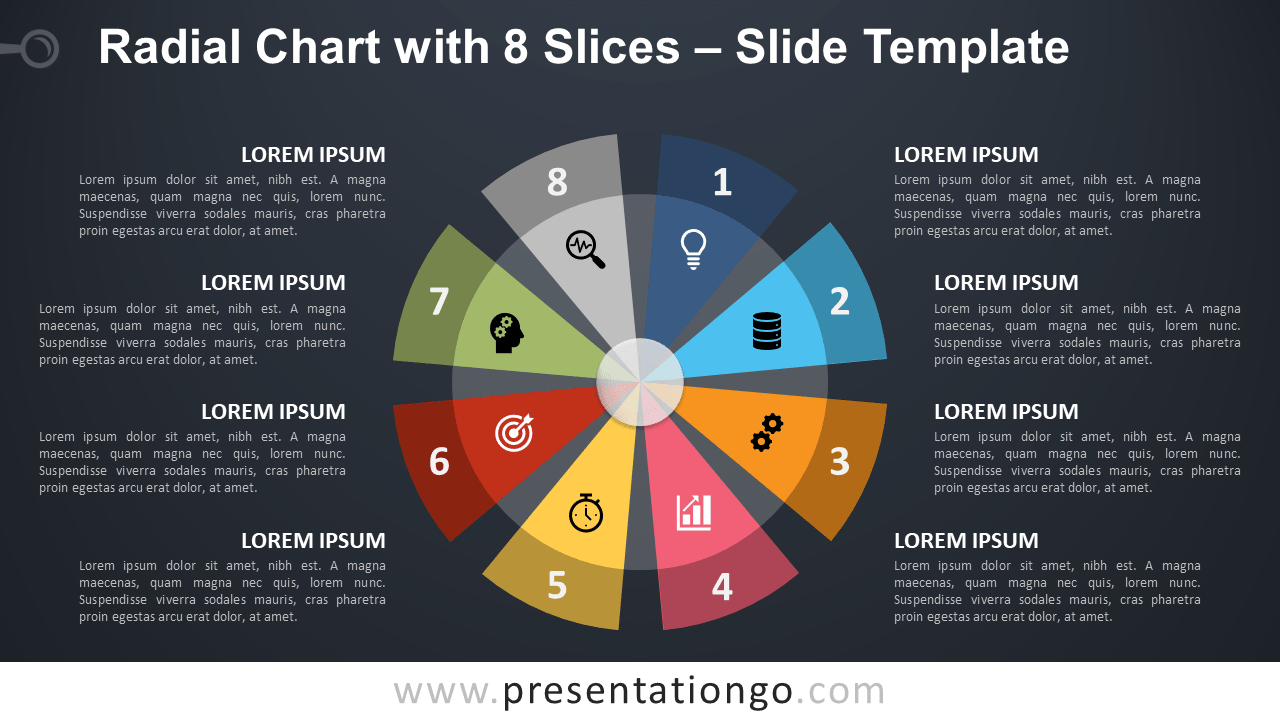
Free radial chart with 6 slices for PowerPoint and Google Slides. Circle chart with 6 equal slices and empty spaces in-between. Editable graphics with numbers and text placeholders.
Radial Chart w/ 6 Slices
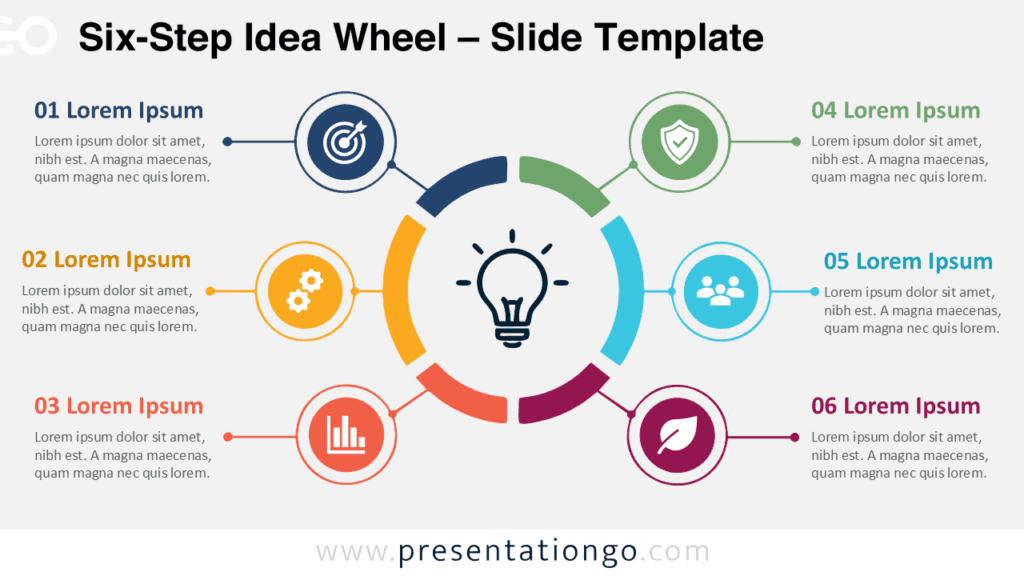
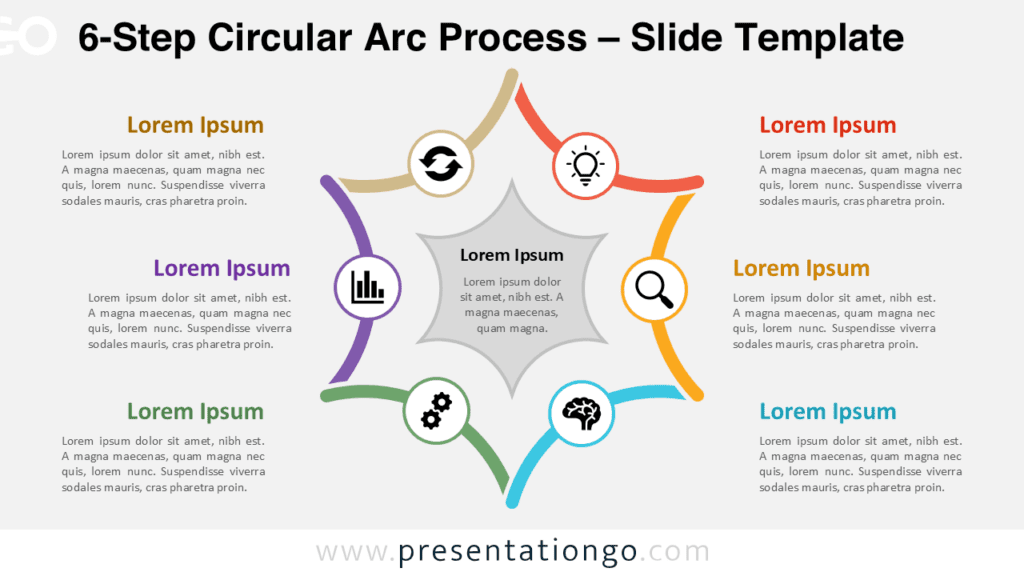
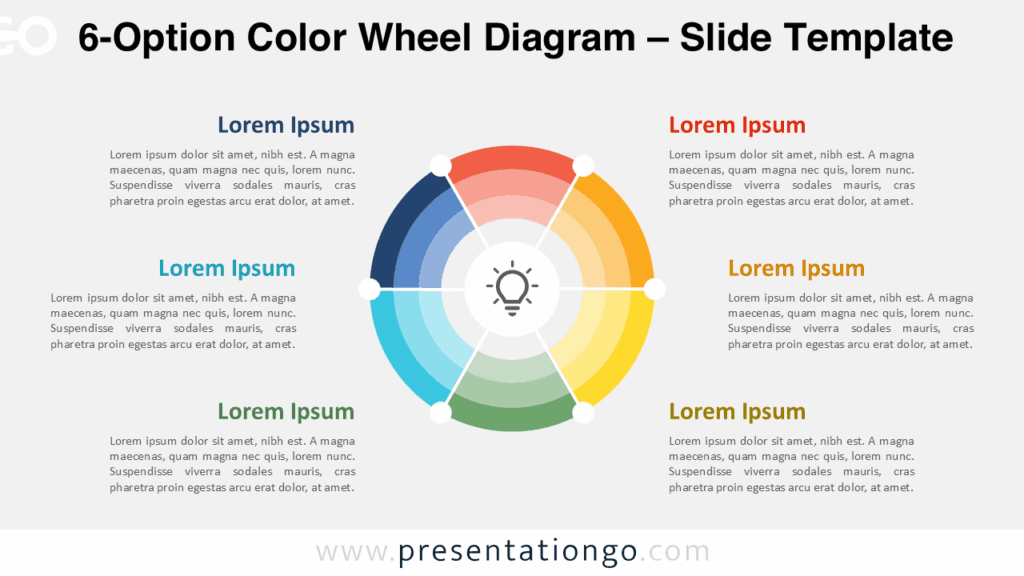
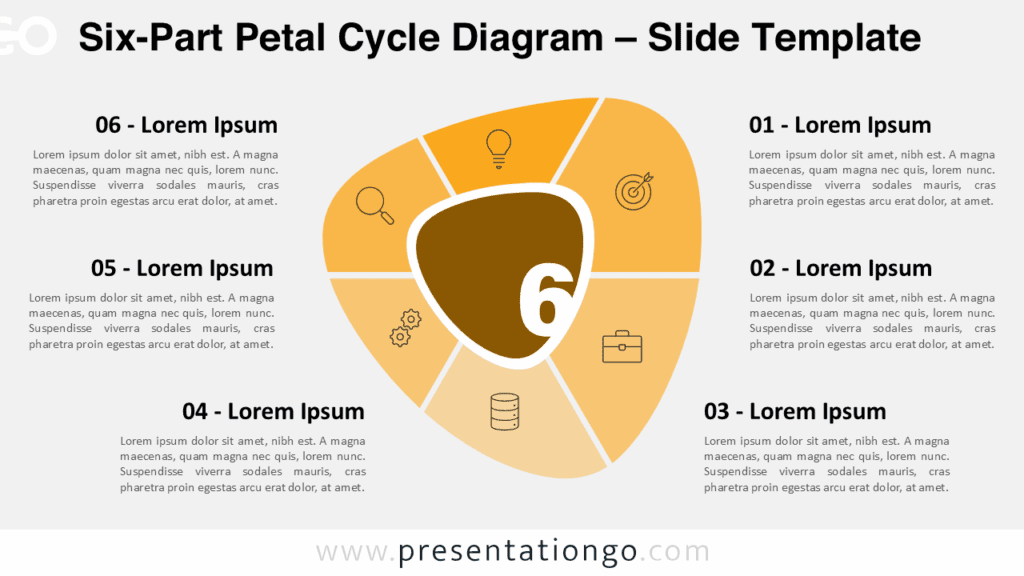
Use this circular diagram to show how 6 individual parts form a whole. It will also be great to illustrate the relationship to a central idea.
Other purposes: to represent a continuing sequence of 6 stages, tasks, or events in a circular flow, and to illustrate 6 ideas or concepts.
Shapes are 100% editable: colors and sizes can be easily changed.
The “Lorem Ipsum” text is for illustrative purposes only. Therefore, you should edit it to fit your own needs. Also, feel free to customize this diagram with your selection of icons (to insert an icon under PowerPoint, go to Insert > Icons…)
Includes 2 slide option designs: Standard (4:3) and Widescreen (16:9).
Widescreen (16:9) size preview:


This ‘Radial Chart w/ 6 Slices for PowerPoint and Google Slides’ features:
- 2 unique slides
- Light and Dark layout
- Ready to use template with numbers and text placeholders
- Completely editable shapes
- Uses a selection of editable PowerPoint icons
- Standard (4:3) and Widescreen (16:9) aspect ratios
- PPTX file and Google Slides
Free fonts used:
- Helvetica (System Font)
- Calibri (System Font)
The complete Radial Chart with Slices collection:


Comments are closed.