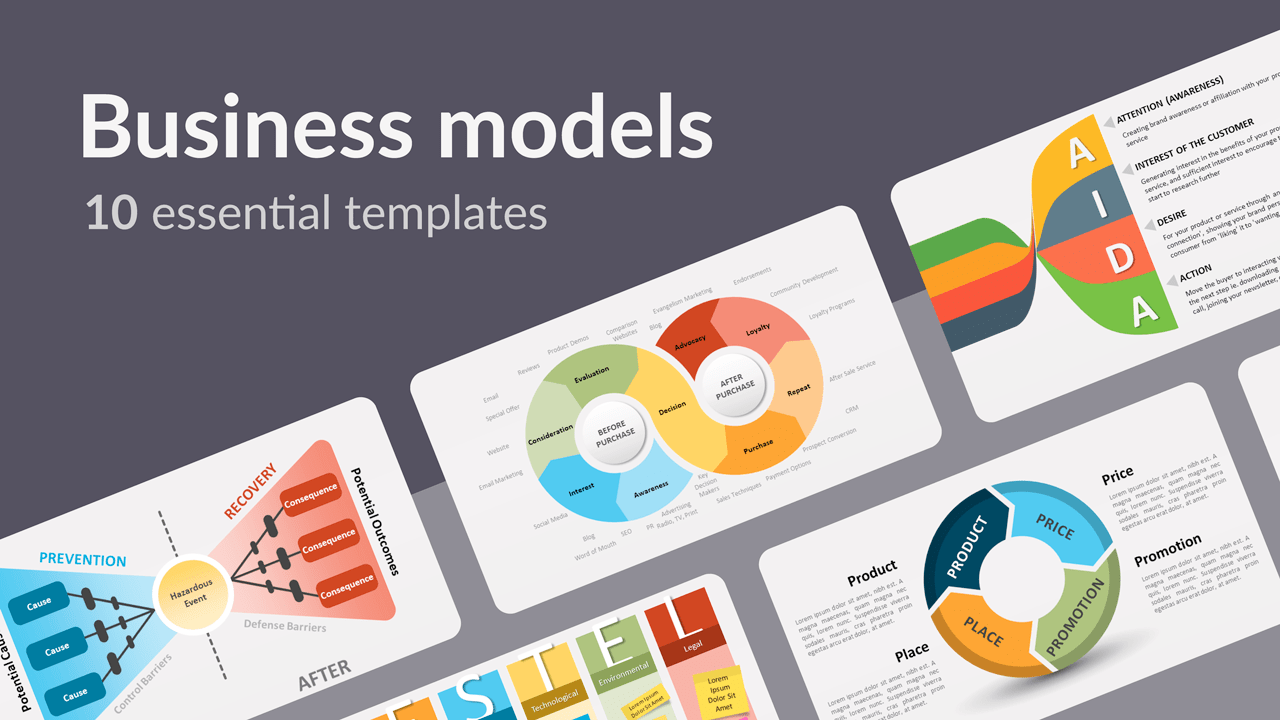
If you are searching for attractive visuals for your next business or marketing presentation, you have come to the right place! We are indeed proud to present you with 10 of our most popular business model templates for PowerPoint and Google Slides. These 10 options of charts and diagrams will be your guarantee for successful presentations.
A picture is worth a thousand words, and a clear professional chart or diagram will save you from long explanations. Whether you want to shape a business plan or share your concepts and projects, these 10 business model templates will definitely make your job easier.
Let the images speak for themselves! The visual impact you can create on your audience is an essential part in getting your ideas across. As a matter of fact, once you combine a sharp speech with an attractive visual support, the convincing job is done.
SMART, SWOT, PESTEL, and AIDA are the acronyms of success. There is no viable business plan without these basic tools and all of them are part of our selection. In addition, marketers will find the Customer Journey, the Four Ps, and other free diagrams to showcase their strategies. There’s no time to lose: let’s get down to business.
1. SMART Goals

This free SMART Goals template for PowerPoint and Google Slides is made of colorful 3D blocks to highlight each one of the letters and their meaning: S stands for Specific, M for Measurable, A for Achievable, R for Relevant, and T for Time-bound. You will also find editable graphics and text placeholders to personalize your presentation. The SMART acronym is not only easy to remember but also an essential tool when it comes to setting clear goals in any business plan.
2. The Customer Journey

Your marketing strategy has to take the customer journey into account. This indispensable instrument describes every stage of the user journey, both before and after purchase. Every marketer will be able to explain to their teams how each phase is crucial to increase sales. This free Customer Journey slide template offers a creative and colorful 8-figure illustration of the nine key phases of the customer journey. It is indeed the perfect tool to expose and explain the buyer’s journey in a crystal-clear manner.
3. The Four Ps of Marketing

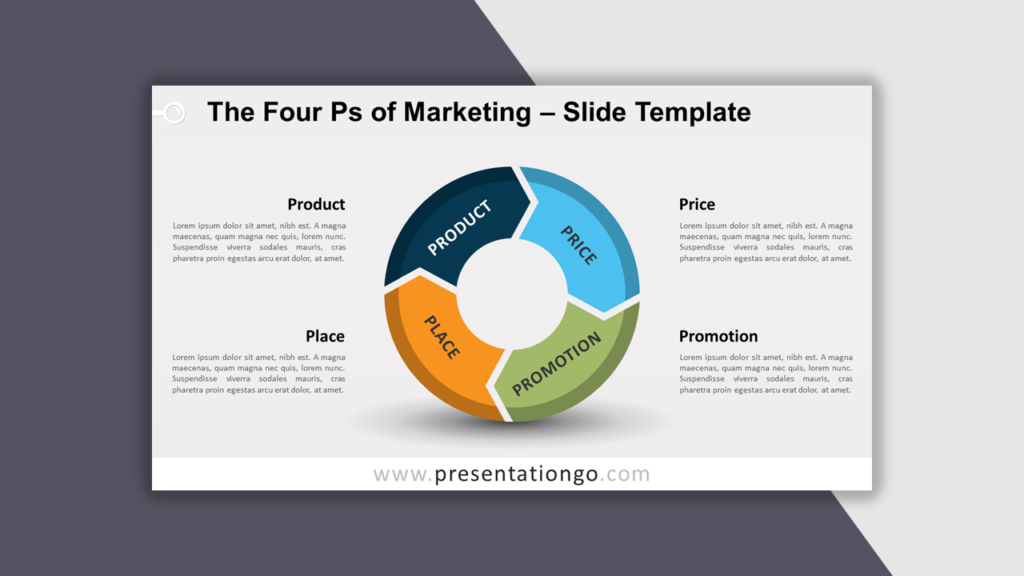
Product, Price, Promotion, and Place: not everyone is familiar with the Four Ps of Marketing. This simple and elegant circular diagram will be your best partner to enlighten your audience and specify each one of the sections thanks to the text placeholders. This free template made of 4 circular arrows is the ideal cycle process diagram to expose what is also known as the “marketing mix”. If you want to display your marketing management decisions, use this free 4 Ps of Marketing slide template for Google Slides and PowerPoint.
4. Iceberg Diagram

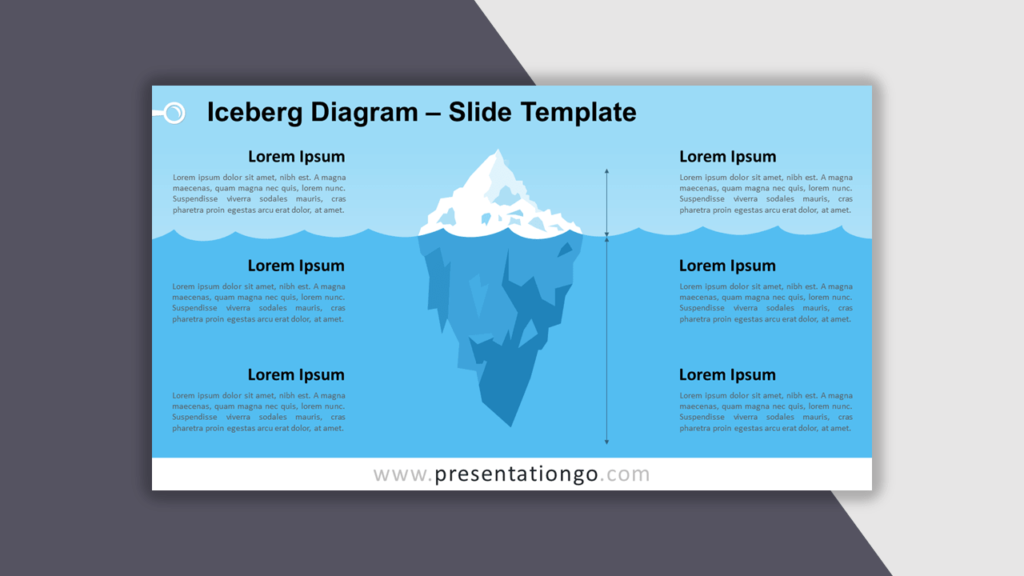
“This is just the tip of the iceberg”. This metaphor we employ in everyday life is also part of a large number of theories. In business, advertising, psychology, branding, and marketing, the iceberg analogy is commonly used to illustrate that only a very small amount (the “tip”) of information is available or visible, whereas the “real” information is either unavailable or hidden from direct observation. This free Iceberg diagram for PowerPoint and Google Slides shows both parts of the iceberg, both above and below the water parts, and includes text placeholders to adapt this iceberg principle to any field you need.
5. SWOT Analysis

The SWOT analysis needs no introduction: it is probably one of the most used tools for planning and decision-making. It is applicable to any field of work and even in your personal life! This strategic planning model helps you identify your Strengths and Weaknesses and examine the Opportunities and Threats that you face. Our modern and original design includes a two-by-two table with sticky note labels, which you can easily customize and position.
6. PESTEL Analysis

This PESTEL analysis slide template will help you audit and organize external influences on your business or on any project. That is why PESTEL is the perfect complement to SWOT. This method helps you identify and understand the external factors (or risks) that influence an organization. It refers to 6 factors: Political, Economic, Social, Technological, Environmental, and Legal. Our design will allow you to brainstorm with your team and organize all 6 factors into 6 vertical parts thanks to the editable sticky notes.
7. Bowtie Diagram

Another useful tool to analyze risks is the Bowtie Method. This risk-assessment diagram for PowerPoint and Google Slides was created to identify and understand the relationships of risks, from their causes to their consequences. This visual concept with the shape of a bowtie aims to analyze and understand the pathways of risk from its causes (the “before” part on the left) to its consequences (the “after” part on the right).
8. Porter’s Five Forces

When it comes to analyzing your level of competition, Porter’s Five Forces is an essential instrument. This classic method aims to assess the competitive environment: the threat of new entrants, bargaining power of suppliers, bargaining power of customers, threat of substitute products or services, and intensity of competitive rivalry. This ready-to-use template is ideal to assess and clearly visualize your level of competition. Once you analyze your results, you will be able to implement the appropriate strategy to outdo your competitors.
9. Strategy Diamond

This free strategy diamond template for PowerPoint works as a checklist to show all the parts of an organization’s strategy. Created by Donald Hambrick and James Fredrickson, this strategy model includes 5 elements: the economic logic as the central idea and arenas, differentiators, vehicles, and staging as the elements that fit together and reinforce each other to establish a successful and effective business plan.
10. AIDA: Twisted Banners

This free AIDA PowerPoint diagram offers you an elegant and creative design thanks to its colorful twisted banners. These 4 horizontal banners provide you with an alternative to the usual AIDA pyramid model. This famous acronym stands for Attention or Awareness, Interest of the Customer, Desire and Action. It is widely used in marketing and advertising and it describes the different steps taken by a customer in the process of purchasing a product or service.


