Skip to content
PresentationGO
  • Explore
    • Templates
      • Abstract
      • Sports
      • Business
      • Religion & Holidays
      • Nature
      • Technology
      • Professions
      • Flat Lays & Scenes
      • Health & Recreation
      • Color Palettes
      • Education
      • Food & Drink
      • Science
      • CertificatesNEW
      • All Templates
    • Charts & Diagrams
      • Processes
        • Circular
        • Linear
        • Alternating
        • Stairs
        • Bending
      • Funnels
      • Pyramids
      • Matrix Charts
      • Business Models
      • Non-Data-Driven Chart Alternatives
      • Radial Diagrams
      • Flow Charts
      • Data-Driven Charts & Graphs
      • Organizational Charts
      • Clusters & Relationships
      • Venn Diagrams
      • All Charts & Diagrams
    • Text & Tables
      • Text Boxes
      • Comparisons
      • Paper & Banners
      • Numbered Lists
      • Speaking Bubbles
      • Pricing Tables
      • Bullet Point / Text Layouts
      • Contents & Table of Contents
      • Quotes
      • Word Clouds
      • To-do & Checklists
      • All Text & Tables
    • Timelines & Planning
      • Calendars
      • Timelines
      • Gantt Charts
      • Agenda
      • All Timelines & Planning
    • Graphics & Metaphors
      • Concepts
      • Silhouettes & People
      • Light Bulbs
      • Trees
      • Letters & Numbers
      • Signs
      • Mockups
      • Food
      • Money
      • Road
      • Target and Goals
      • All Graphics & Metaphors
    • Maps & Flags
      • Flag Templates
      • Continent Maps
      • Country Maps
        • Africa
        • Asia
        • Australia / Oceania
        • Europe
        • North America
        • South America
      • World Maps
      • All Maps
    • AI ImagesNEW
  • Search by
    • Colors
      • Black
      • Blue
      • Brown
      • Gray
      • Green
      • Light Blue
      • Orange
      • Pink
      • Purple
      • Red
      • White
      • Yellow
    • Steps (Options)
      • 2 options
      • 3 options
      • 4 options
      • 5 options
      • 6 options
      • 7 options
      • 8 options
      • 9 options
      • 10 options
      • 12 options
  • Templates
  • Charts & Diagrams
  • Text & Tables
  • Timelines & Planning
  • Graphics & Metaphors
  • Maps & Flags
  • AI ImagesNEW
Charts & Diagrams > Data-Driven Charts & Graphs > Pie Charts

Pie Charts

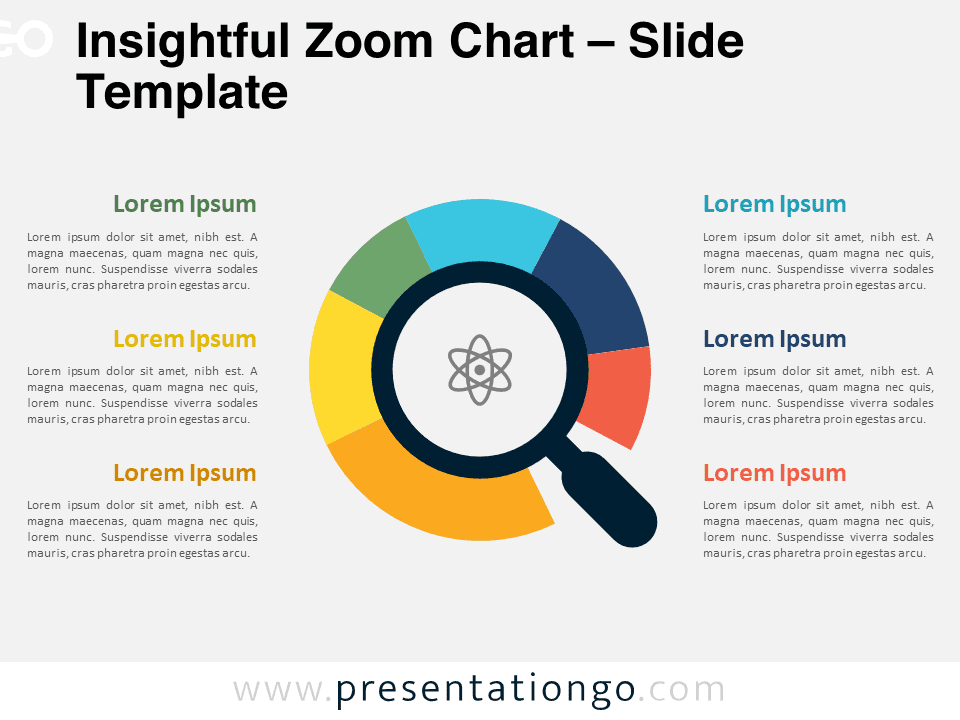
Explore our diverse selection of 32 Pie Charts, thoughtfully designed to enrich your PowerPoint and Google Slides presentations. These eye-catching, data-driven charts provide a powerful way to represent proportions and percentages, helping your audience to quickly grasp the relationships between different data segments.

Pie charts are ideal for illustrating the composition of a whole, revealing the distribution of individual parts, or comparing the shares of various categories. They are applicable in numerous situations, such as market share analysis, budget allocation, customer segmentation, or resource management. In your presentation slides, they will bring focus and visual interest to your data, supporting your main points and enhancing your narrative.

Our collection features a wide range of designs, layouts, and color schemes to fit your unique needs. Personalize these flexible templates to harmonize with your brand identity and presentation theme, achieving a professional and cohesive look.

Transform your PowerPoint and Google Slides presentations with our striking Pie Charts, and let your data tell a compelling story.

Preview of the Four-Stage Serpentine Chart template for PowerPoint, featuring four connected pie charts in a flowing serpentine design.
Charts & Diagrams
4 optionsData-driven

Four-Stage Serpentine Chart

Visualize processes or segmented data with this Four-Stage Serpentine Chart for PowerPoint and Google Slides, featuring editable data-driven pie charts.

Google Slides, PPTX

4:316:9

Preview of the Three-Stage Serpentine Chart template designed for PowerPoint presentations, featuring a connected flow with pie charts.
Charts & Diagrams
3 optionsData-driven

Three-Stage Serpentine Chart

The Three-Stage Serpentine Chart visualizes data with three connected pie charts, ideal for showcasing sequential processes and comparisons in presentations.

Google Slides, PPTX

4:316:9

Insightful Zoom Chart for PowerPoint template featuring a data-driven doughnut pie chart, fully editable and customizable for dynamic presentations.
Charts & Diagrams
Data-driven

Insightful Zoom Chart

Transform complex data into compelling visuals with this customizable, data-driven doughnut chart template featuring a central magnifying glass for focused insights.

PPTX

4:316:9

Preview of the featured Semicircle Chart Template Slide for PowerPoint presentations.
Charts & Diagrams
Data-driven

Pie Chart With Shadow

Infographic-inspired pie chart with shadow for visually appealing, professional data display in PowerPoint & Google Slides.

Google Slides, PPTX

4:316:9

Preview of the featured Semicircle Chart Template Slide for PowerPoint presentations.
Charts & Diagrams
Data-driven

Semicircle Chart

The Semicircle Chart Template is your key to creating presentations that pair professional design with impactful data storytelling.

Google Slides, PPTX

4:316:9

Preview of modern doughnut chart templates for PowerPoint presentations
Charts & Diagrams
Data-driven

Modern Doughnut Charts for PowerPoint and Google Slides

Discover editable Modern Doughnut Charts for PowerPoint to dynamically present data with style and precision in your slides.

Google Slides, PPTX

4:316:9

Free Hexadonut Charts for PowerPoint
Charts & Diagrams
3 optionsData-driven

Hexadonut Charts for PowerPoint and Google Slides

Transform your presentations with data-driven Hexadonut Charts for PowerPoint and Google Slides. Ideal for comparing simple data across various topics.

Google Slides, PPTX

4:316:9

Free Lime & Lemon Data-Driven Chart for PowerPoint
Charts & Diagrams
Data-driven

Lime and Lemon Data-Driven Chart for PowerPoint

Free lime and lemon data-driven chart for PowerPoint and Google Slides. A fresh and creative alternative to your regular pie-charts.

PPTX

4:316:9

Free Pie Chart with 7 Sections for PowerPoint
Charts & Diagrams
7 options

Pie Chart with 7 Sections for PowerPoint and Google Slides

Free pie chart with 7 sections for PowerPoint and Google Slides. A beautiful steering wheel look-alike circular diagram with seven parts.

Google Slides, PPTX

4:316:9

Free Pie Chart with 6 Sections for PowerPoint
Charts & Diagrams
6 options

Pie Chart with 6 Sections for PowerPoint and Google Slides

Free pie chart with 6 sections for PowerPoint and Google Slides. A beautiful steering wheel look-alike circular diagram with six parts.

Google Slides, PPTX

4:316:9

Free Pie Chart with 5 Sections for PowerPoint
Charts & Diagrams
5 options

Pie Chart with 5 Sections for PowerPoint and Google Slides

Free pie chart with 5 sections for PowerPoint and Google Slides. A beautiful steering wheel look-alike circular diagram with five parts.

Google Slides, PPTX

4:316:9

Free Pie Chart with 4 Sections for PowerPoint
Charts & Diagrams
4 options

Pie Chart with 4 Sections for PowerPoint and Google Slides

Free pie chart with 4 sections for PowerPoint and Google Slides. A beautiful steering wheel look-alike circular diagram with four parts.

Google Slides, PPTX

4:316:9

Older posts
Page1 Page2 Page3 Next →
Search Templates by categories
Templates Charts & Diagrams Text & Tables Maps & Flags Timelines & Planning Graphics & Metaphors
Search Templates by colors
Support us
icon of a coffee cup for 'support us' - PresentationGo
... buying us a coffee

Love our templates? Show your support with a coffee!

Donate Here

Thank you for fueling our creativity!

Logotype PresentationGo
Content

Templates

Charts & Diagrams

Text & Tables

Graphics & Metaphors

Timelines & Planning

Maps

AI ImagesNEW

Best-Ofs & Tips

Legal

Terms and Conditions

Privacy Statement

Cookie Policy

Digital Millennium Copyright Act (DMCA) Policy

Disclaimer

Help

Contact us

FAQ

Templates

Charts & Diagrams

Text & Tables

Graphics & Metaphors

Timelines & Planning

Maps

Best-Ofs & Tips

Terms and Conditions

Privacy Statement

Cookie Policy

Digital Millennium Copyright Act (DMCA) Policy

Disclaimer

Contact us

FAQ

© Copyright 2025 Ofeex | PRESENTATIONGO® is a registered trademark | All rights reserved.

PresentationGO
Manage your privacy

To provide the best experiences, we and our partners use technologies like cookies to store and/or access device information. Consenting to these technologies will allow us and our partners to process personal data such as browsing behavior or unique IDs on this site and show (non-) personalized ads. Not consenting or withdrawing consent, may adversely affect certain features and functions.

Click below to consent to the above or make granular choices. Your choices will be applied to this site only. You can change your settings at any time, including withdrawing your consent, by using the toggles on the Cookie Policy, or by clicking on the manage consent button at the bottom of the screen.

Functional Always active
The technical storage or access is strictly necessary for the legitimate purpose of enabling the use of a specific service explicitly requested by the subscriber or user, or for the sole purpose of carrying out the transmission of a communication over an electronic communications network.
Preferences
The technical storage or access is necessary for the legitimate purpose of storing preferences that are not requested by the subscriber or user.
Statistics
The technical storage or access that is used exclusively for statistical purposes. The technical storage or access that is used exclusively for anonymous statistical purposes. Without a subpoena, voluntary compliance on the part of your Internet Service Provider, or additional records from a third party, information stored or retrieved for this purpose alone cannot usually be used to identify you.
Marketing
The technical storage or access is required to create user profiles to send advertising, or to track the user on a website or across several websites for similar marketing purposes.
Statistics

Marketing

Features
Always active

Always active
Manage options Manage services Manage {vendor_count} vendors Read more about these purposes
Manage preferences
{title} {title} {title}
PresentationGO
Manage your privacy
We use cookies to enhance your browsing experience, serve personalized ads or content, and analyze our traffic. By clicking "Accept", you consent to our use of cookies.
Functional Always active
The technical storage or access is strictly necessary for the legitimate purpose of enabling the use of a specific service explicitly requested by the subscriber or user, or for the sole purpose of carrying out the transmission of a communication over an electronic communications network.
Preferences
The technical storage or access is necessary for the legitimate purpose of storing preferences that are not requested by the subscriber or user.
Statistics
The technical storage or access that is used exclusively for statistical purposes. The technical storage or access that is used exclusively for anonymous statistical purposes. Without a subpoena, voluntary compliance on the part of your Internet Service Provider, or additional records from a third party, information stored or retrieved for this purpose alone cannot usually be used to identify you.
Marketing
The technical storage or access is required to create user profiles to send advertising, or to track the user on a website or across several websites for similar marketing purposes.
Statistics

Marketing

Features
Always active

Always active
Manage options Manage services Manage {vendor_count} vendors Read more about these purposes
Manage preferences
{title} {title} {title}

Thank you for downloading from PresentationGO!

AI Images are free to use with no attribution required (though appreciated).

Presentation templates are also free, but require attribution.
For example, you can include this credit somewhere visible:

If you enjoy our free resources and want to support us, you can:

Buy us a coffee

Thank you for your continued support!