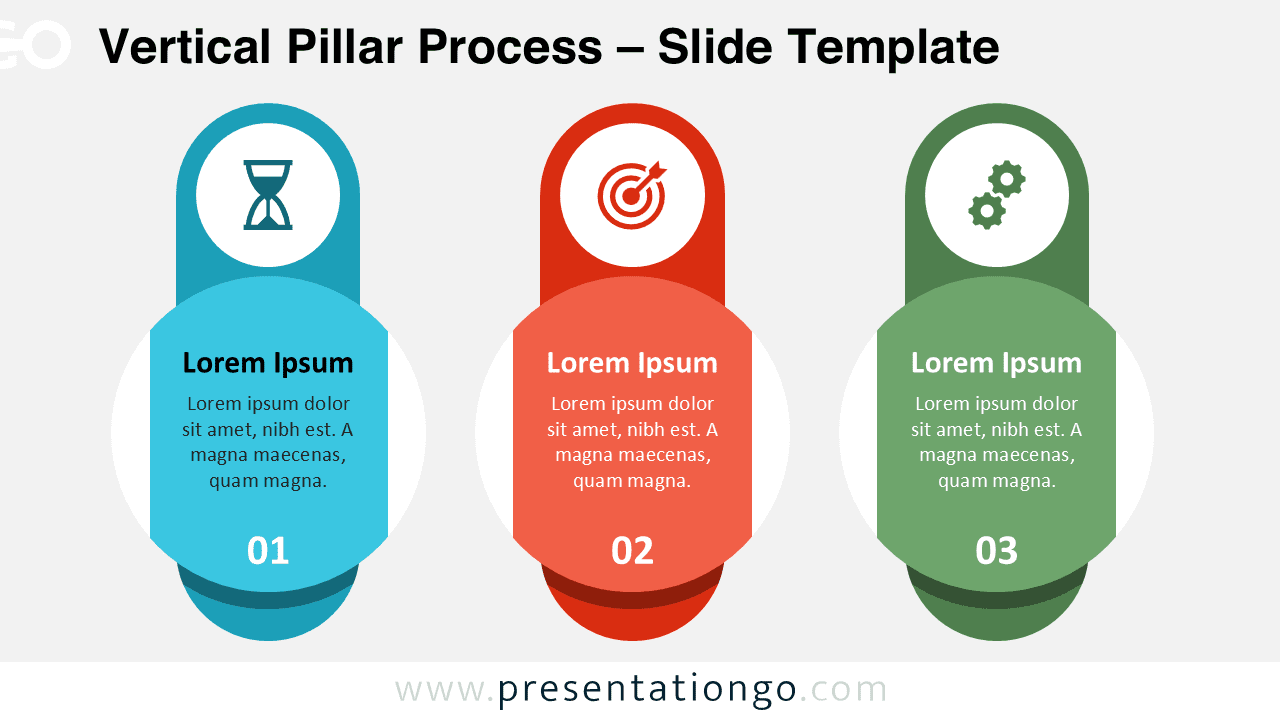
Download this free Vertical Pillar Process diagram for PowerPoint and Google Slides. Fully customizable 3-step layout.
Google Slides, PPTX
16:9
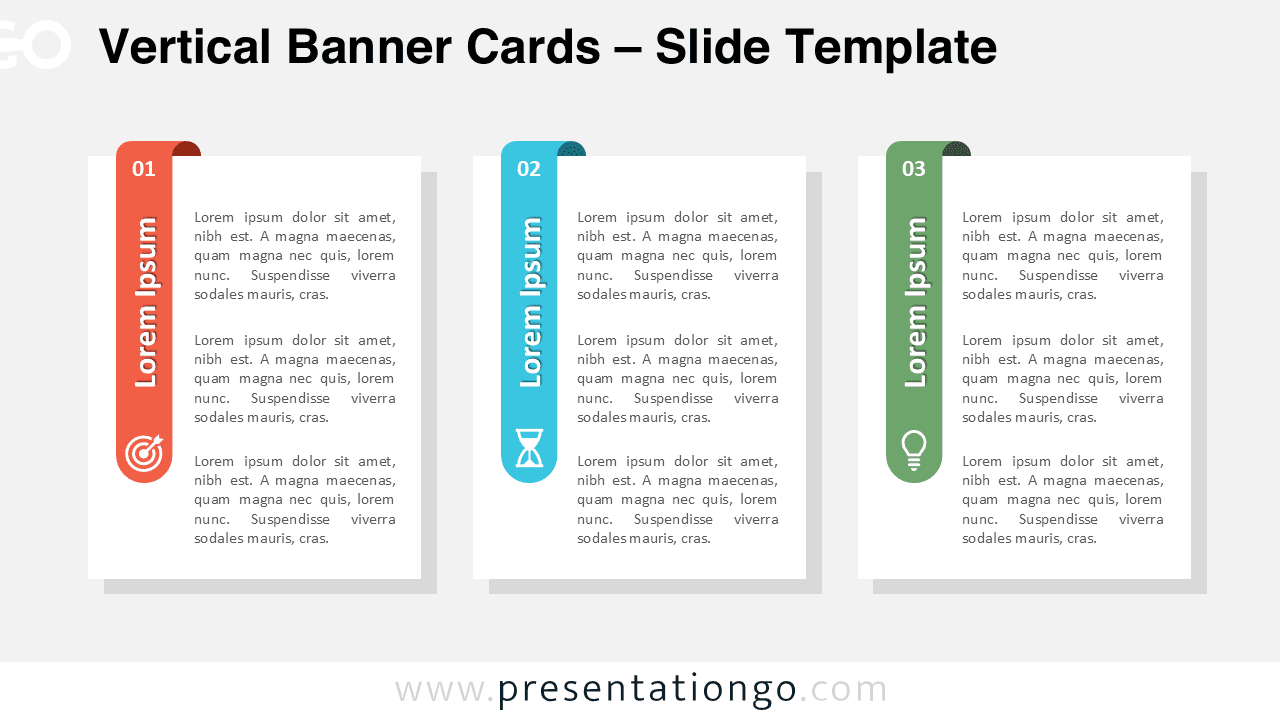
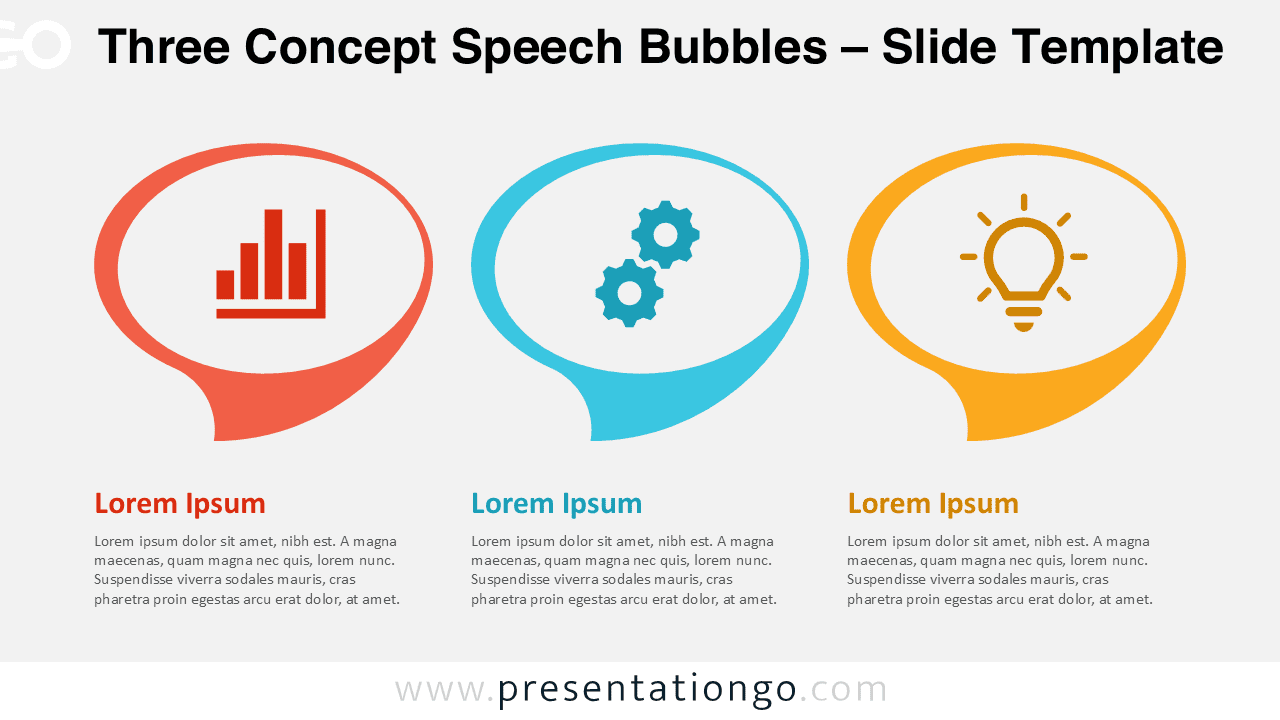
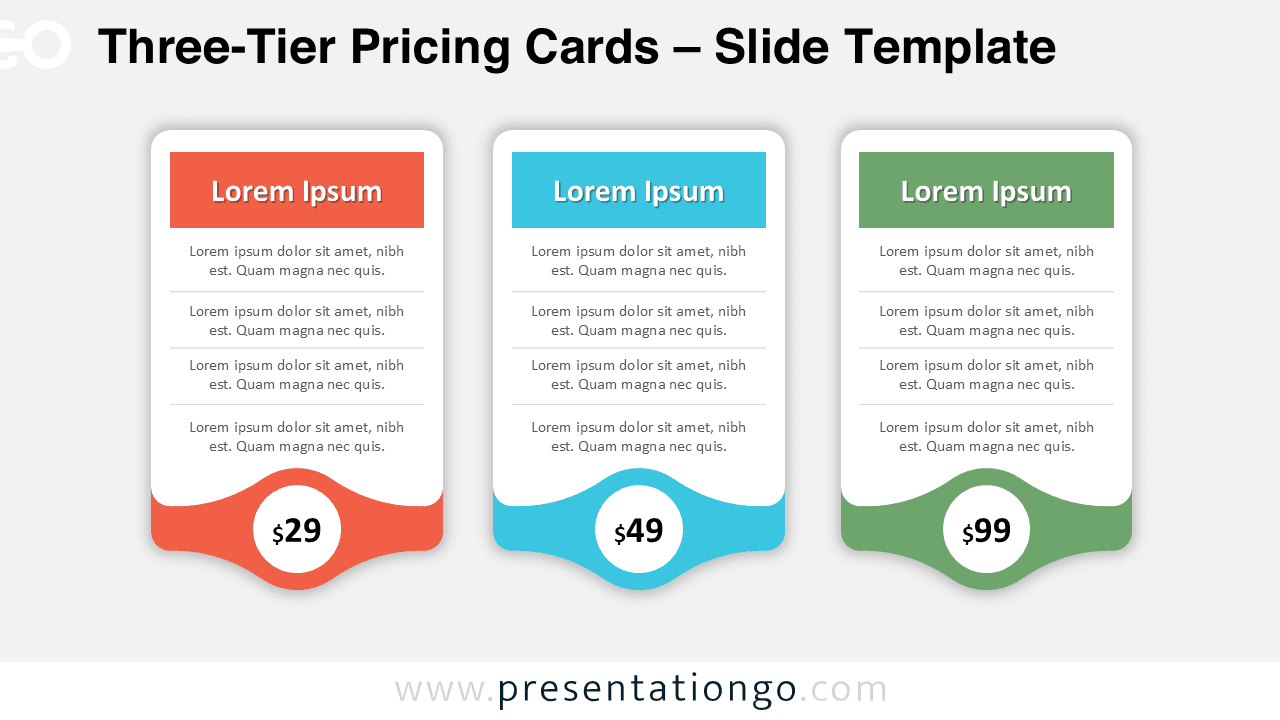
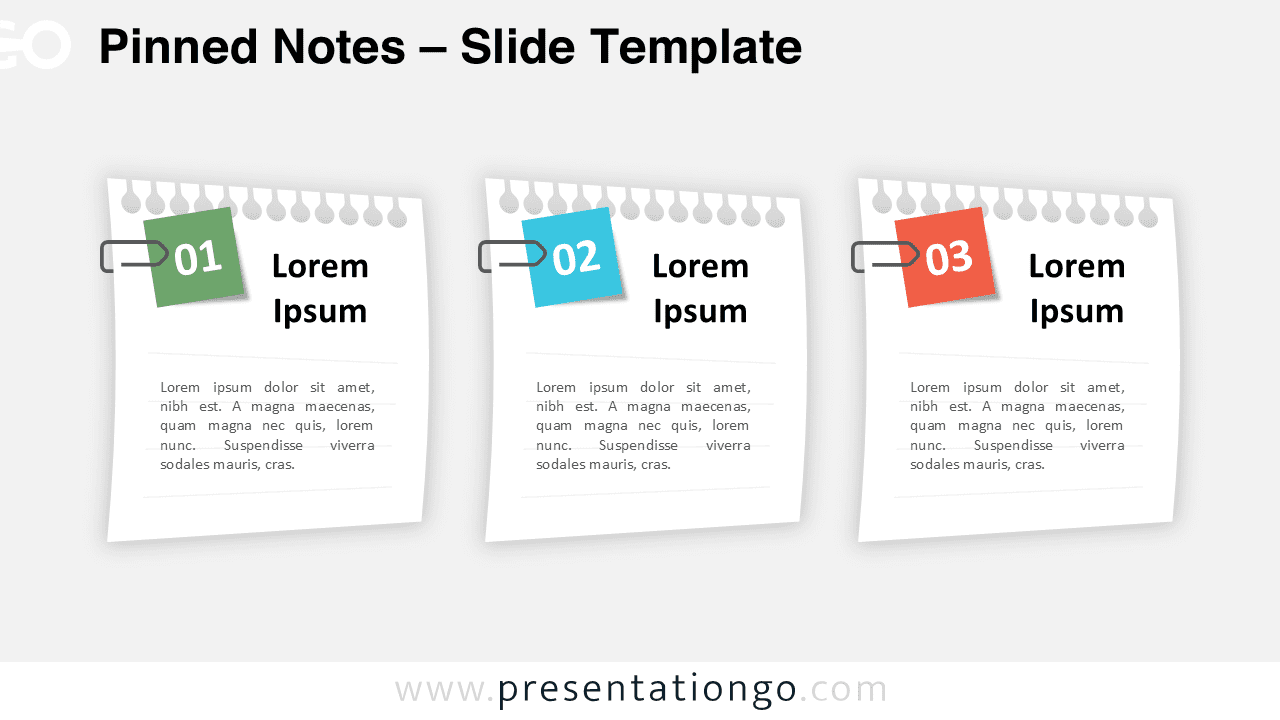
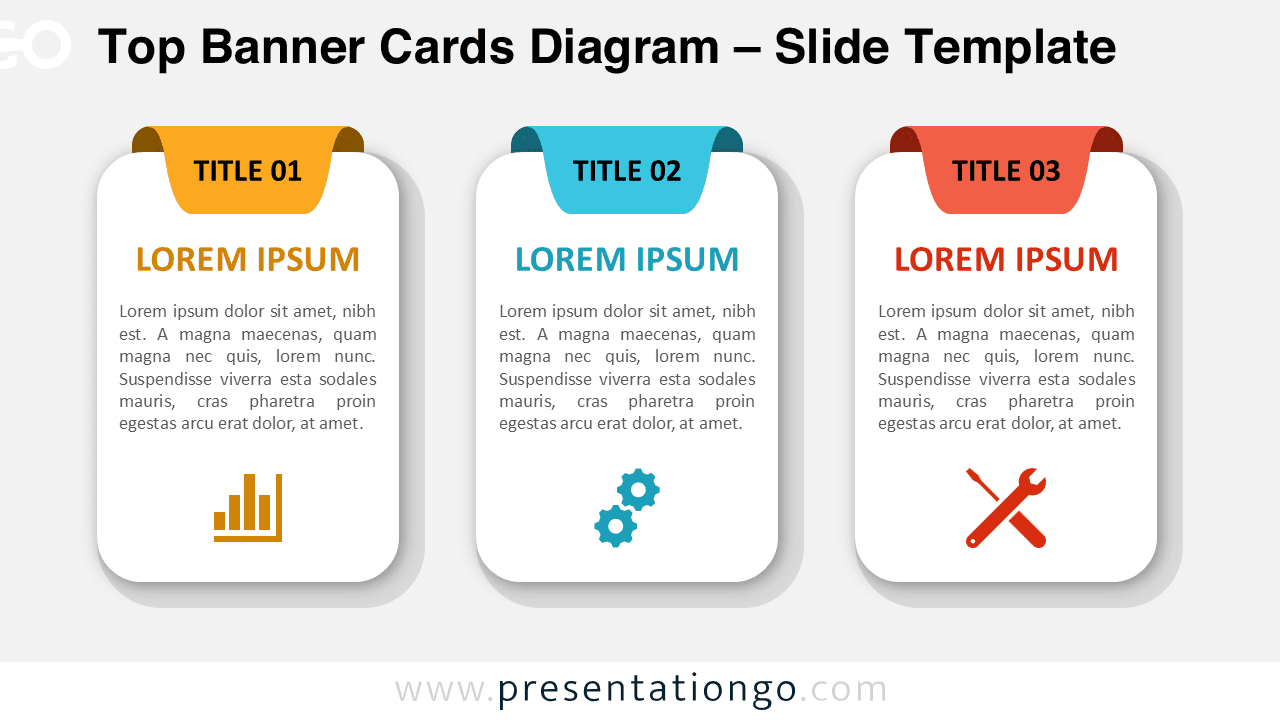
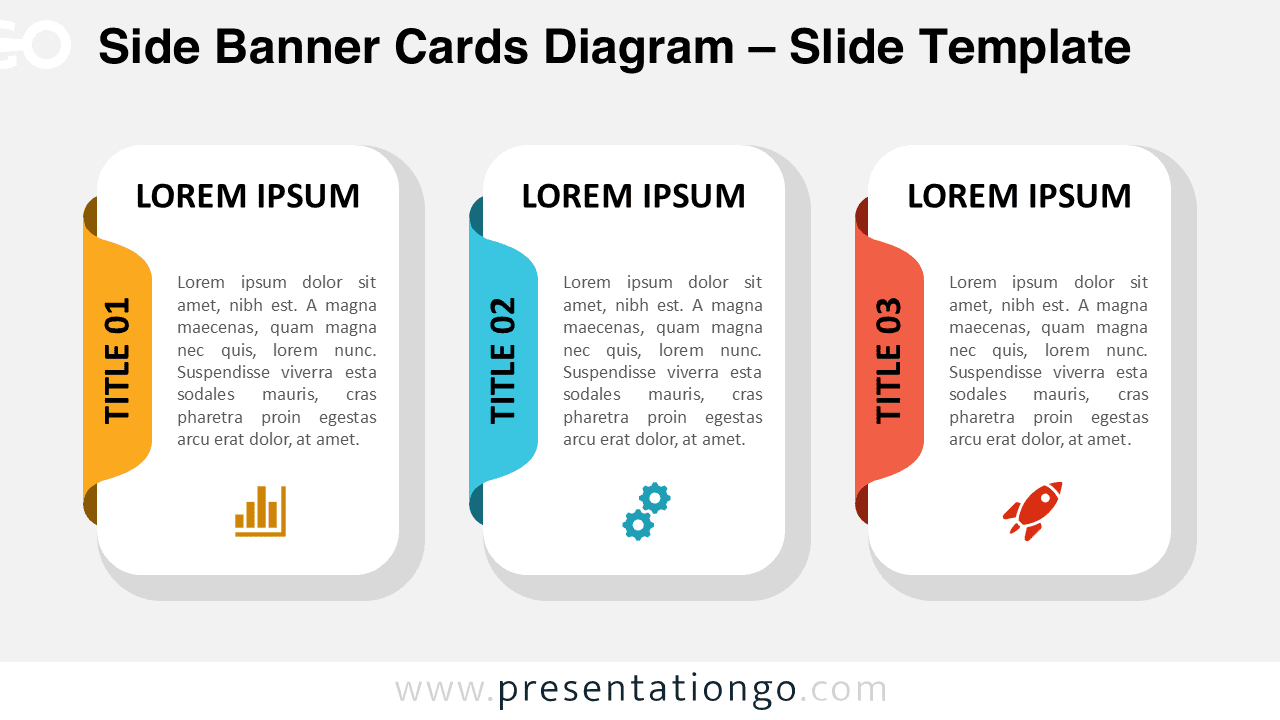
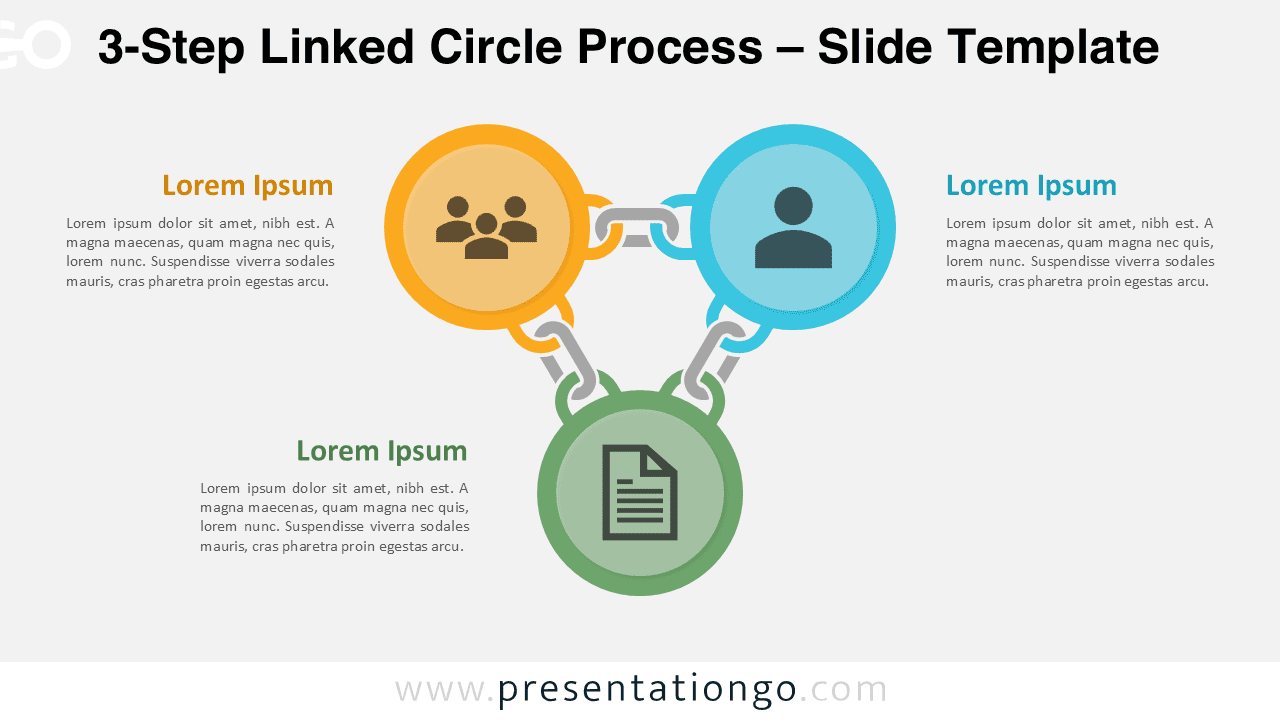
Discover all our templates for Google Slides and PowerPoint that include 3 options. These can be 3 steps in a process, 3 items in a list, 3 elements of a chart, etc.
Google Slides, PPTX
16:9
Google Slides, PPTX
16:9
Google Slides, PPTX
16:9
Google Slides, PPTX
16:9
Google Slides, PPTX
16:9
Google Slides, PPTX
16:9
Google Slides, PPTX
16:9
Google Slides, PPTX
16:9
Google Slides, PPTX
16:9
Google Slides, PPTX
16:9
Google Slides, PPTX
16:9
Google Slides, PPTX
16:9
