Latest Templates
Discover our vast, continually growing collection of free, high-quality, customizable templates & Infographics for PowerPoint and Google Slides presentations, designed to enhance your visual communication.

Businesswoman Using Laptop
Get the Businesswoman Using Laptop template for PowerPoint & Google Slides. A sleek, professional illustration ideal for productivity and leadership slides.
Google Slides, PPTX
16:94:3

Celestial Lantern Template
The Celestial Lantern Template offers a magical blend of ornate lanterns and starry night skies for creating captivating cultural and spiritual presentations.
Google Slides, POTX
16:9
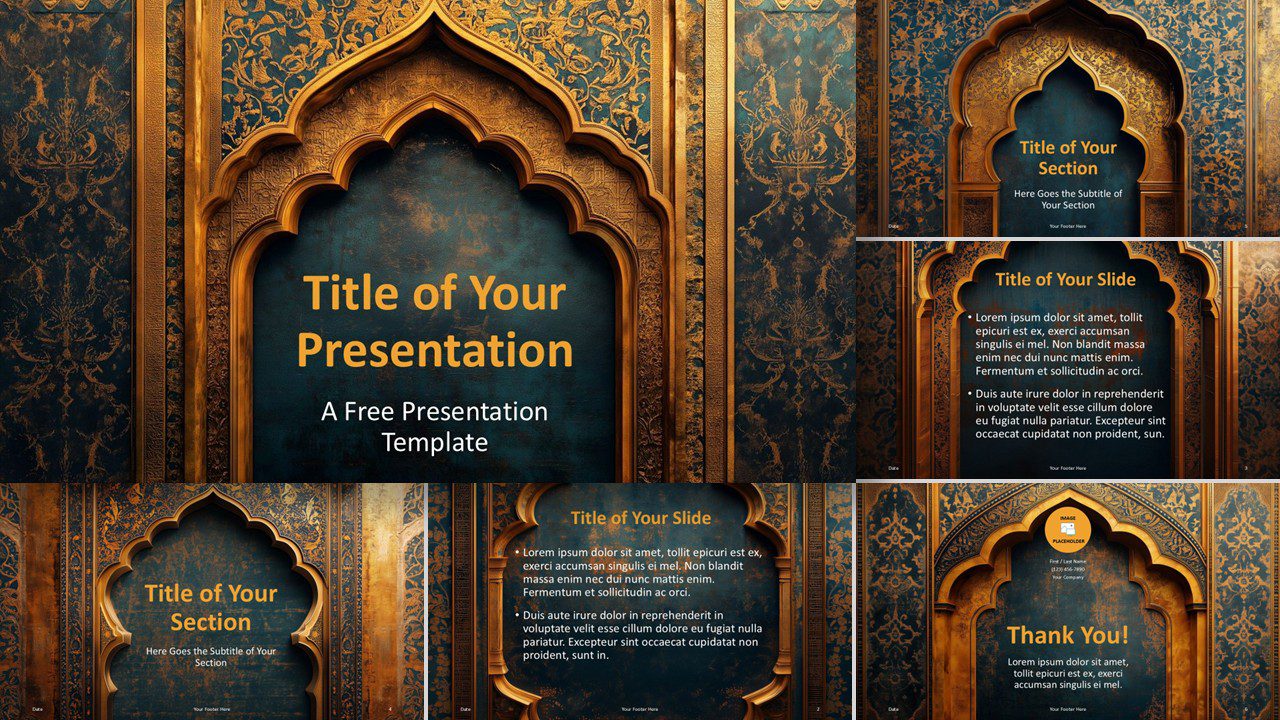
Majestic Arabesque Template
A regal Arabesque template with stunning golden motifs and deep teal backgrounds—ideal for professional and cultural presentations.
Google Slides, POTX
16:9

Arabian Nights Template
Immerse your audience in a mystical nightscape with the Arabian Nights Template for PowerPoint & Google Slides, featuring gold, blue, and elegant details.
Google Slides, POTX
16:9

Cornered Cards
Present your ideas with clarity using this four-step, card-based template for PowerPoint & Google Slides.
Google Slides, PPTX
4:316:9

Connected Outline Circles
A five-step process diagram with connected outline circles, perfect for visualizing workflows and sequential steps in PowerPoint & Google Slides.
Google Slides, PPTX
4:316:9

Embattled Flow Diagram
This Embattled Flow Diagram for PowerPoint and Google Slides features a four-step alternating design for clear process visualization.
Google Slides, PPTX
4:316:9
Icon Accent Cards
Organize content visually with Icon Accent Cards for PowerPoint & Google Slides – a four-step infographic with bold numbers and icons.
Google Slides, PPTX
4:316:9

Cascading Steps
Guide your audience through sequential information using this four-step diagram with distinctive folded banner design.
Google Slides, PPTX
4:316:9
Vertical Chevron Timeline
Organize key milestones with this Vertical Chevron Timeline—an alternating 5-step layout for structured project visualization and planning.
Google Slides, PPTX
4:316:9

Dual Teardrops
Download the Dual Teardrops diagram for PowerPoint & Google Slides, a two-step comparison template ideal for business strategies and decision-making.
Google Slides, PPTX
4:316:9

Speech Talk Template
Use the Speech Talk Template to create compelling presentations with a communication-focused layout, ideal for brainstorming, coaching, and public speaking.
Google Slides, POTX
16:9
