Skip to content
PresentationGO
  • Explore
    • Templates
      • Abstract
      • Sports
      • Business
      • Religion & Holidays
      • Nature
      • Technology
      • Professions
      • Flat Lays & Scenes
      • Health & Recreation
      • Color Palettes
      • Education
      • Food & Drink
      • Science
      • CertificatesNEW
      • All Templates
    • Charts & Diagrams
      • Processes
        • Circular
        • Linear
        • Alternating
        • Stairs
        • Bending
      • Funnels
      • Pyramids
      • Matrix Charts
      • Business Models
      • Non-Data-Driven Chart Alternatives
      • Radial Diagrams
      • Flow Charts
      • Data-Driven Charts & Graphs
      • Organizational Charts
      • Clusters & Relationships
      • Venn Diagrams
      • All Charts & Diagrams
    • Text & Tables
      • Text Boxes
      • Comparisons
      • Paper & Banners
      • Numbered Lists
      • Speaking Bubbles
      • Pricing Tables
      • Bullet Point / Text Layouts
      • Contents & Table of Contents
      • Quotes
      • Word Clouds
      • To-do & Checklists
      • All Text & Tables
    • Timelines & Planning
      • Calendars
      • Timelines
      • Gantt Charts
      • Agenda
      • All Timelines & Planning
    • Graphics & Metaphors
      • Concepts
      • Silhouettes & People
      • Light Bulbs
      • Trees
      • Letters & Numbers
      • Signs
      • Mockups
      • Food
      • Money
      • Road
      • Target and Goals
      • All Graphics & Metaphors
    • Maps & Flags
      • Flag Templates
      • Continent Maps
      • Country Maps
        • Africa
        • Asia
        • Australia / Oceania
        • Europe
        • North America
        • South America
      • World Maps
      • All Maps
    • AI ImagesNEW
  • Search by
    • Colors
      • Black
      • Blue
      • Brown
      • Gray
      • Green
      • Cream
      • Light Blue
      • Orange
      • Pink
      • Purple
      • Gold
      • Red
      • White
      • Yellow
      • Teal
    • Steps (Options)
      • 2 options
      • 3 options
      • 4 options
      • 5 options
      • 6 options
      • 7 options
      • 8 options
      • 9 options
      • 10 options
      • 12 options
  • Templates
  • Charts & Diagrams
  • Text & Tables
  • Timelines & Planning
  • Graphics & Metaphors
  • Maps & Flags
  • AI ImagesNEW

Comparison

This series of charts, text boxes, and visual metaphors includes all our templates to compare two or more elements. Nothing compares to this great collection for Google Slides and PowerPoint!

Refine Your Search

Light background Flame Percentage Chart for PowerPoint featuring four orange and gray flame graphics with percentages and description text.
Charts & Diagrams
4 optionsData-driven

Flame Percentage Chart

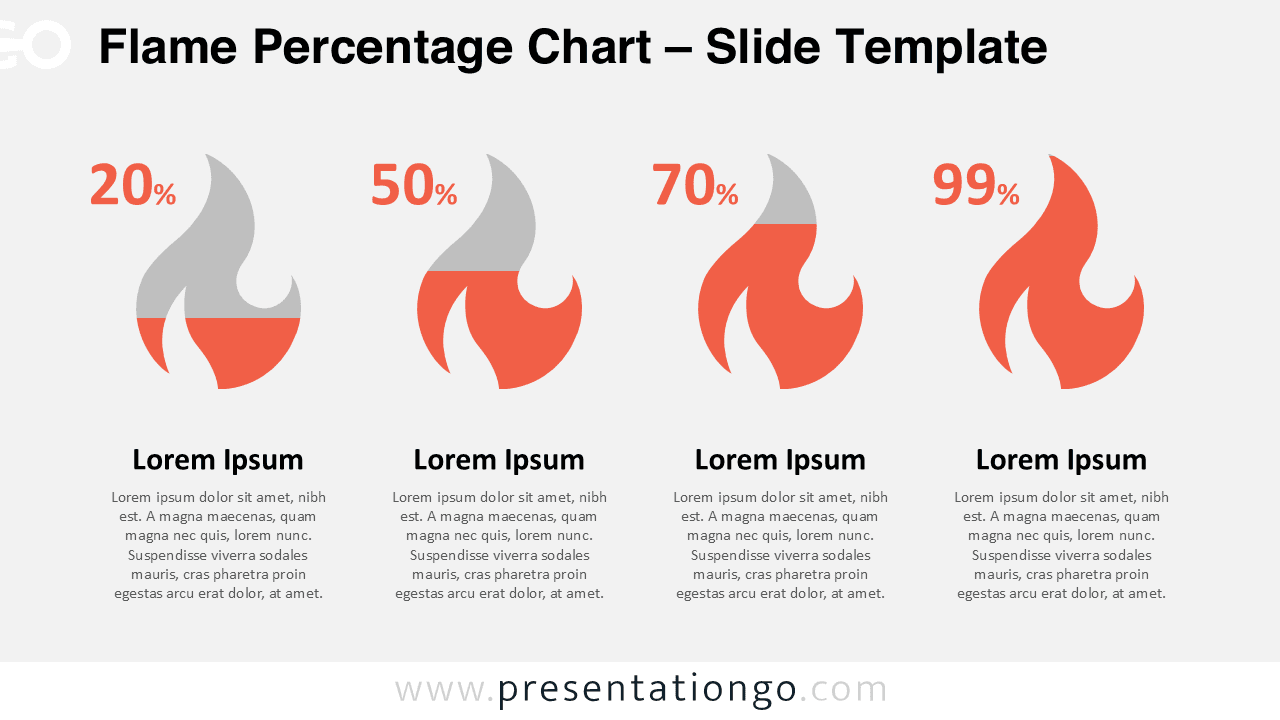
Free Flame Percentage Chart for PowerPoint to compare four percentages with data-driven flame graphics.

PPTX

16:9

Three-column rounded tab cards infographic for PowerPoint and Google Slides
Text & Tables

Do vs Don’t Checklist

A clean side-by-side Do vs Don’t list to compare best practices vs pitfalls. Two slides in light and dark.

Google Slides, PPTX

16:9

Three-column rounded tab cards infographic for PowerPoint and Google Slides
Text & Tables
3 options

Rounded Tab Cards

Present features or steps using curved header cards. Fully editable.

Google Slides, PPTX

16:9

blue 5-option perspective panels diagram for PowerPoint presentations
4 slides
Text & Tables
5 options

5-Option Perspective Panels

Display five ideas or steps with this sleek 5-Option Perspective Panels for PowerPoint and Google Slides.

Google Slides, PPTX

16:9

blue 3-option perspective panels layout for PowerPoint slides
4 slides
Text & Tables
3 options

3-Option Perspective Panels

Visualize three ideas or steps with this sleek 3-Option Perspective Panels slide for PowerPoint and Google Slides.

Google Slides, PPTX

16:9

Three rounded info blocks layout with light background in PowerPoint
Text & Tables
3 options

Three Info Blocks

A simple, rounded card layout to present three ideas or steps in PowerPoint and Google Slides.

Google Slides, PPTX

16:9

Light background 6-card layout diagram for PowerPoint and Google Slides
Text & Tables
6 options

Rounded Card Grid

Showcase six points with this modern Rounded Card Grid design.

Google Slides, PPTX

16:9

Editable 4-step folded process layout on light background for PowerPoint and Google Slides.
Text & Tables
4 options

4-Step Folded Process

Showcase your workflow or comparison with a stylish 4-Step Folded Process layout.

Google Slides, PPTX

16:9

Free 6-Option Speedometer Gauge PowerPoint template and Google Slides diagram featuring a widescreen layout with four gauges on a light background.
Charts & Diagrams
6 options

6-Option Speedometer Gauge Diagram

Compare multiple KPIs at a glance with this 6-level speedometer gauge diagram designed for clear dashboards and performance reporting.

Google Slides, PPTX

4:316:9

Free 5-Option Speedometer Gauge PowerPoint template and Google Slides diagram featuring a widescreen layout with four gauges on a light background.
Charts & Diagrams
5 options

5-Option Speedometer Gauge Diagram

A dashboard-style diagram with five categories to present KPIs and evaluation results across multiple performance areas.

Google Slides, PPTX

4:316:9

Free 4-Option Speedometer Gauge PowerPoint template and Google Slides diagram featuring a widescreen layout with four gauges on a light background.
Charts & Diagrams
4 options

4-Option Speedometer Gauge Diagram

Compare four performance indicators in one dashboard with this 4-option gauge diagram template, fully editable for PowerPoint and Google Slides.

Google Slides, PPTX

4:316:9

Free 3-Option Speedometer Gauge PowerPoint template and Google Slides diagram featuring a widescreen layout with four gauges on a light background.
Charts & Diagrams
3 options

3-Option Speedometer Gauge Diagram

Showcase and compare four KPIs with this three-level gauge diagram designed for dashboard-style presentations.

Google Slides, PPTX

4:316:9

Older posts
Newer posts
← Previous Page1 … Page3 Page4 Page5 … Page23 Next →
Search Templates by categories
Templates Charts & Diagrams Text & Tables Maps & Flags Timelines & Planning Graphics & Metaphors
Search Templates by colors
Support us
icon of a coffee cup for 'support us' - PresentationGo
... buying us a coffee

Love our templates? Show your support with a coffee!

Donate Here

Thank you for fueling our creativity!

Logotype PresentationGo
Content

Templates

Charts & Diagrams

Text & Tables

Graphics & Metaphors

Timelines & Planning

Maps

AI ImagesNEW

Best-Ofs & Tips

Legal

Terms and Conditions

Privacy Statement

Cookie Policy

Digital Millennium Copyright Act (DMCA) Policy

Disclaimer

Help

Contact us

FAQ

Templates

Charts & Diagrams

Text & Tables

Graphics & Metaphors

Timelines & Planning

Maps

Best-Ofs & Tips

Terms and Conditions

Privacy Statement

Cookie Policy

Digital Millennium Copyright Act (DMCA) Policy

Disclaimer

Contact us

FAQ

© Copyright 2026 Ofeex | PRESENTATIONGO® is a registered trademark | All rights reserved.

PresentationGO
Cookies & Privacy

To provide the best experiences, we and our partners use technologies like cookies to store and/or access device information. Consenting to these technologies will allow us and our partners to process personal data such as browsing behavior or unique IDs on this site and show (non-) personalized ads. Not consenting or withdrawing consent, may adversely affect certain features and functions.

Click below to consent to the above or make granular choices. Your choices will be applied to this site only. You can change your settings at any time, including withdrawing your consent, by using the toggles on the Cookie Policy, or by clicking on the manage consent button at the bottom of the screen.

Functional Always active
Needed for the website to work properly.
Preferences
Remember your settings (like language or display choices).
Statistics
The technical storage or access that is used exclusively for statistical purposes. Help us understand how the site is used so we can improve it (Google Analytics).
Marketing
Used to show relevant ads and measure ad performance (Google AdSense and partners).
Statistics

Marketing

Features
Always active

Always active
  • Manage options
  • Manage services
  • Manage {vendor_count} vendors
  • Read more about these purposes
Manage preferences
  • {title}
  • {title}
  • {title}
PresentationGO
Cookies & Privacy

We use cookies to run the site, measure traffic, and show ads that help keep our downloads free. Manage your choices anytime.

Functional Always active
Needed for the website to work properly.
Preferences
Remember your settings (like language or display choices).
Statistics
The technical storage or access that is used exclusively for statistical purposes. Help us understand how the site is used so we can improve it (Google Analytics).
Marketing
Used to show relevant ads and measure ad performance (Google AdSense and partners).
Statistics

Marketing

Features
Always active

Always active
  • Manage options
  • Manage services
  • Manage {vendor_count} vendors
  • Read more about these purposes
Manage preferences
  • {title}
  • {title}
  • {title}

Thank you for downloading from PresentationGO!

AI Images are free to use with no attribution required (though appreciated).

Presentation templates are also free, but require attribution.
For example, you can include this credit somewhere visible:

If you enjoy our free resources and want to support us, you can:

Buy us a coffee

Thank you for your continued support!