Skip to content
PresentationGO
  • Explore
    • Templates
      • Abstract
      • Sports
      • Business
      • Religion & Holidays
      • Nature
      • Technology
      • Professions
      • Flat Lays & Scenes
      • Health & Recreation
      • Color Palettes
      • Education
      • Food & Drink
      • Science
      • CertificatesNEW
      • All Templates
    • Charts & Diagrams
      • Processes
        • Circular
        • Linear
        • Alternating
        • Stairs
        • Bending
      • Funnels
      • Pyramids
      • Matrix Charts
      • Business Models
      • Non-Data-Driven Chart Alternatives
      • Radial Diagrams
      • Flow Charts
      • Data-Driven Charts & Graphs
      • Organizational Charts
      • Clusters & Relationships
      • Venn Diagrams
      • All Charts & Diagrams
    • Text & Tables
      • Text Boxes
      • Comparisons
      • Paper & Banners
      • Numbered Lists
      • Speaking Bubbles
      • Pricing Tables
      • Bullet Point / Text Layouts
      • Contents & Table of Contents
      • Quotes
      • Word Clouds
      • To-do & Checklists
      • All Text & Tables
    • Timelines & Planning
      • Calendars
      • Timelines
      • Gantt Charts
      • Agenda
      • All Timelines & Planning
    • Graphics & Metaphors
      • Concepts
      • Silhouettes & People
      • Light Bulbs
      • Trees
      • Letters & Numbers
      • Signs
      • Mockups
      • Food
      • Money
      • Road
      • Target and Goals
      • All Graphics & Metaphors
    • Maps & Flags
      • Flag Templates
      • Continent Maps
      • Country Maps
        • Africa
        • Asia
        • Australia / Oceania
        • Europe
        • North America
        • South America
      • World Maps
      • All Maps
    • AI ImagesNEW
  • Search by
    • Colors
      • Black
      • Blue
      • Brown
      • Gray
      • Green
      • Light Blue
      • Orange
      • Pink
      • Purple
      • Red
      • White
      • Yellow
    • Steps (Options)
      • 2 options
      • 3 options
      • 4 options
      • 5 options
      • 6 options
      • 7 options
      • 8 options
      • 9 options
      • 10 options
      • 12 options
  • Templates
  • Charts & Diagrams
  • Text & Tables
  • Timelines & Planning
  • Graphics & Metaphors
  • Maps & Flags
  • AI ImagesNEW
Charts & Diagrams > Organizational Charts

Organizational Charts

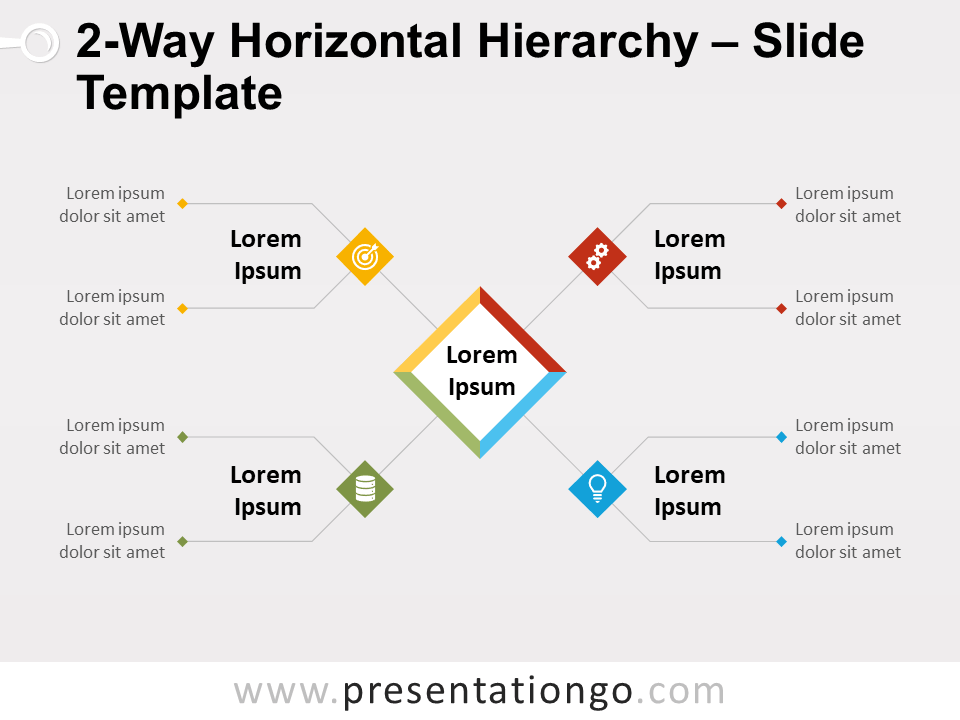
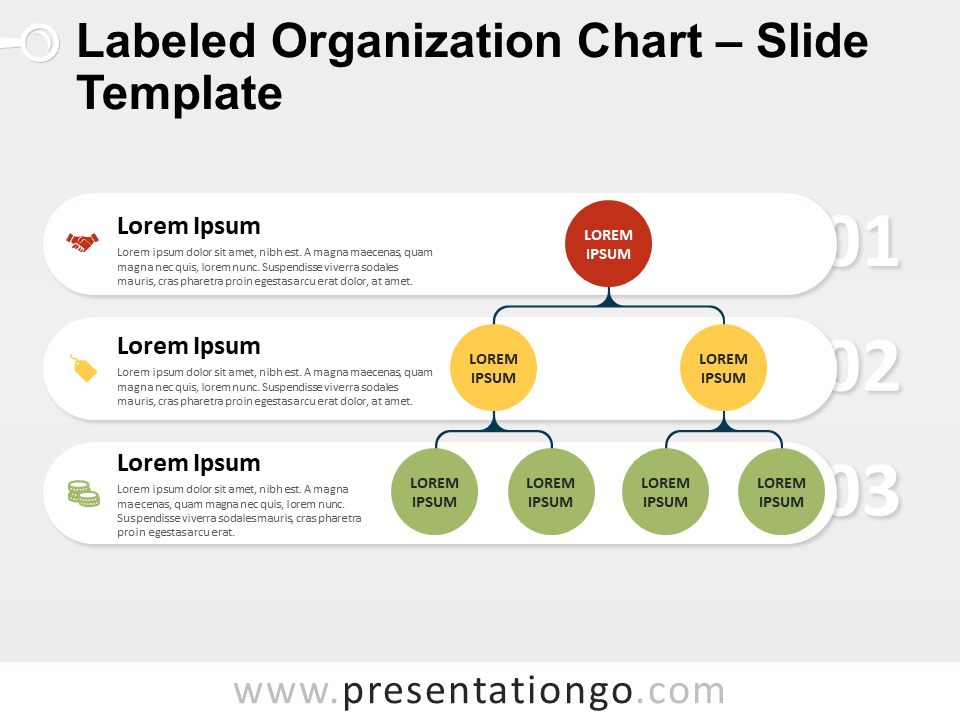
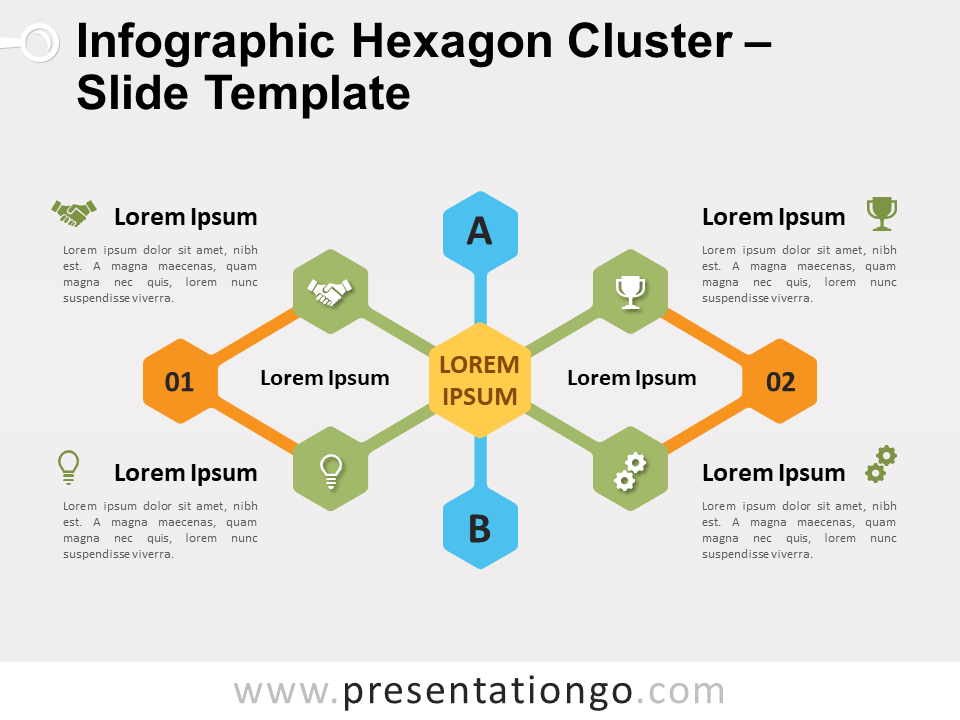
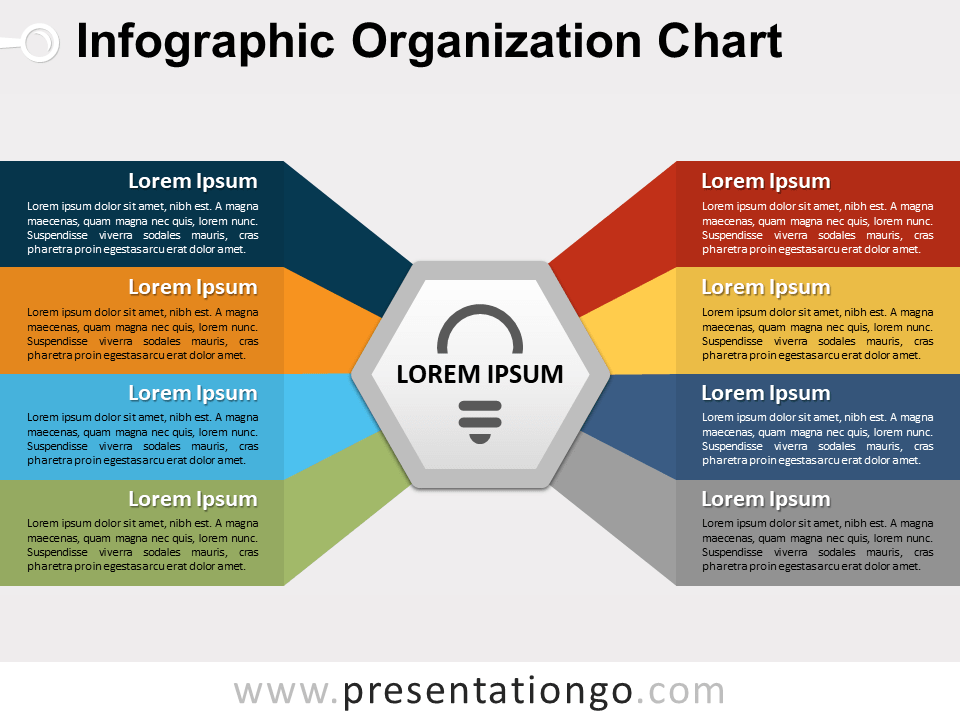
Discover our extensive collection of 27 organizational chart templates for PowerPoint and Google Slides. These professionally designed templates are perfect for illustrating your company’s hierarchy, team structure, or departmental divisions. They are highly customizable and adaptable to any presentation need.

Organizational charts, also known as org charts, are visual representations of a company’s hierarchical structure. They display the relationships among employees, teams, and departments, making it easy to understand reporting lines and communication channels.

Org charts are ideal for presentations involving human resources, management, team building, and corporate restructuring. With our templates, you can easily showcase your company’s structure, highlight key positions, or demonstrate the flow of authority within your organization.

Elevate your presentations with our sleek, professional organizational chart templates. They offer a variety of styles and formats, allowing you to choose the perfect design to fit your brand and convey your message effectively.

Free Horizontal Org Chart for PowerPoint
Charts & Diagrams

Horizontal Org Chart for PowerPoint and Google Slides

Free horizontal org chart for PowerPoint and Google Slides. An innovative and colorful alternative to present your organizational diagram.

Google Slides, PPTX

4:316:9

Free Infographic Tree Diagram Template for PowerPoint
Charts & Diagrams

Infographic Tree Diagram for PowerPoint and Google Slides

Free infographic tree diagram for PowerPoint and Google Slides. An infographic organizational chart to show hierarchical information.

Google Slides, PPTX

4:316:9

Free 2-Way Horizontal Hierarchy for PowerPoint
Charts & Diagrams

2-Way Horizontal Hierarchy for PowerPoint and Google Slides

Free 2-Way horizontal hierarchy for PowerPoint and Google Slides. A hierarchy diagram with 4 ideas, that can be divided into 2 sub-ideas each.

Google Slides, PPTX

4:316:9

Free Labeled Organization Chart for PowerPoint
Charts & Diagrams

Labeled Organization Chart for PowerPoint and Google Slides

Simple yet effective circle organigram with 3 levels of hierarchy and horizontal labels.

Google Slides, PPTX

4:316:9

Free Matrix Circle Relationship for PowerPoint
Charts & Diagrams
4 options

Matrix Circle Relationship for PowerPoint and Google Slides

4 circle elements with associated information related to a central main idea.

Google Slides, PPTX

4:316:9

Free Dual Horizontal Hierarchy Chart for PowerPoint
Charts & Diagrams

Dual Horizontal Hierarchy for PowerPoint and Google Slides

A tree structure with horizontal branches.

Google Slides, PPTX

4:316:9

Free Infographic Hexagon Cluster Chart for PowerPoint
Charts & Diagrams

Infographic Hexagon Cluster for PowerPoint and Google Slides

A series of hexagon shapes connected to a central idea.

Google Slides, PPTX

4:316:9

Free Infographic Radial for PowerPoint
Charts & Diagrams

Infographic Radial for PowerPoint and Google Slides

A jellyfish-like infographic radial diagram. For your #PowerPoint and #GoogleSlides presentations

Google Slides, PPTX

4:316:9

Free Infographic Organization Chart for PowerPoint
Charts & Diagrams
4 options8 options

Infographic Organization Chart for PowerPoint and Google Slides

Diagram showing the relation of 8 banners to a central hexagonal element.

Google Slides, PPTX

4:316:9

Free Table Hierarchy for PowerPoint
Charts & Diagrams
3 options

Table Hierarchy for PowerPoint and Google Slides

Tree-like structure diagram with 1 main element and 3 child tables.

Google Slides, PPTX

4:316:9

Free Crab Diagram Template
Charts & Diagrams
8 options

Crab Diagram for PowerPoint and Google Slides

Radial chart with 8 elements connected to a central circle.

Google Slides, PPTX

4:316:9

Free Infographic Hierarchy Tree for PowerPoint
Charts & DiagramsGraphics & Metaphors
6 options

Infographic Hierarchy Tree for PowerPoint

ree diagram with 6 colorful curved trunks and text blocks (leaves) with diagonal rounded corners.

PPTX

4:316:9

Older posts
Newer posts
← Previous Page1 Page2 Page3 Next →
Search Templates by categories
Templates Charts & Diagrams Text & Tables Maps & Flags Timelines & Planning Graphics & Metaphors
Search Templates by colors
Support us
icon of a coffee cup for 'support us' - PresentationGo
... buying us a coffee

Love our templates? Show your support with a coffee!

Donate Here

Thank you for fueling our creativity!

Logotype PresentationGo
Content

Templates

Charts & Diagrams

Text & Tables

Graphics & Metaphors

Timelines & Planning

Maps

AI ImagesNEW

Best-Ofs & Tips

Legal

Terms and Conditions

Privacy Statement

Cookie Policy

Digital Millennium Copyright Act (DMCA) Policy

Disclaimer

Help

Contact us

FAQ

Templates

Charts & Diagrams

Text & Tables

Graphics & Metaphors

Timelines & Planning

Maps

Best-Ofs & Tips

Terms and Conditions

Privacy Statement

Cookie Policy

Digital Millennium Copyright Act (DMCA) Policy

Disclaimer

Contact us

FAQ

© Copyright 2025 Ofeex | PRESENTATIONGO® is a registered trademark | All rights reserved.

PresentationGO
Manage your privacy

To provide the best experiences, we and our partners use technologies like cookies to store and/or access device information. Consenting to these technologies will allow us and our partners to process personal data such as browsing behavior or unique IDs on this site and show (non-) personalized ads. Not consenting or withdrawing consent, may adversely affect certain features and functions.

Click below to consent to the above or make granular choices. Your choices will be applied to this site only. You can change your settings at any time, including withdrawing your consent, by using the toggles on the Cookie Policy, or by clicking on the manage consent button at the bottom of the screen.

Functional Always active
The technical storage or access is strictly necessary for the legitimate purpose of enabling the use of a specific service explicitly requested by the subscriber or user, or for the sole purpose of carrying out the transmission of a communication over an electronic communications network.
Preferences
The technical storage or access is necessary for the legitimate purpose of storing preferences that are not requested by the subscriber or user.
Statistics
The technical storage or access that is used exclusively for statistical purposes. The technical storage or access that is used exclusively for anonymous statistical purposes. Without a subpoena, voluntary compliance on the part of your Internet Service Provider, or additional records from a third party, information stored or retrieved for this purpose alone cannot usually be used to identify you.
Marketing
The technical storage or access is required to create user profiles to send advertising, or to track the user on a website or across several websites for similar marketing purposes.
Statistics

Marketing

Features
Always active

Always active
Manage options Manage services Manage {vendor_count} vendors Read more about these purposes
Manage preferences
{title} {title} {title}
PresentationGO
Manage your privacy
We use cookies to enhance your browsing experience, serve personalized ads or content, and analyze our traffic. By clicking "Accept", you consent to our use of cookies.
Functional Always active
The technical storage or access is strictly necessary for the legitimate purpose of enabling the use of a specific service explicitly requested by the subscriber or user, or for the sole purpose of carrying out the transmission of a communication over an electronic communications network.
Preferences
The technical storage or access is necessary for the legitimate purpose of storing preferences that are not requested by the subscriber or user.
Statistics
The technical storage or access that is used exclusively for statistical purposes. The technical storage or access that is used exclusively for anonymous statistical purposes. Without a subpoena, voluntary compliance on the part of your Internet Service Provider, or additional records from a third party, information stored or retrieved for this purpose alone cannot usually be used to identify you.
Marketing
The technical storage or access is required to create user profiles to send advertising, or to track the user on a website or across several websites for similar marketing purposes.
Statistics

Marketing

Features
Always active

Always active
Manage options Manage services Manage {vendor_count} vendors Read more about these purposes
Manage preferences
{title} {title} {title}

Thank you for downloading from PresentationGO!

AI Images are free to use with no attribution required (though appreciated).

Presentation templates are also free, but require attribution.
For example, you can include this credit somewhere visible:

If you enjoy our free resources and want to support us, you can:

Buy us a coffee

Thank you for your continued support!